Venture Capital
14 December 2023 19:00
Interactive: Comparing Carmaker Revenue vs. Country GDP
German carmaker Volkswagen generated about $291bn between Q1 2021 and Q1 2022, eclipsing the gross domestic product of 76% of United Nations member states, according to visual guide provider Vanarama. Toyota ranked second, with sales worth $276bn over the year. Research shows the wealth of large vehicle manufacturers is such that their revenue underpins the economies of their countries of origin. In some cases, figures from car companies make up nearly 10% of a nation's gross domestic product.
Read details below
Читать полностью…
Venture Capital
13 December 2023 19:00
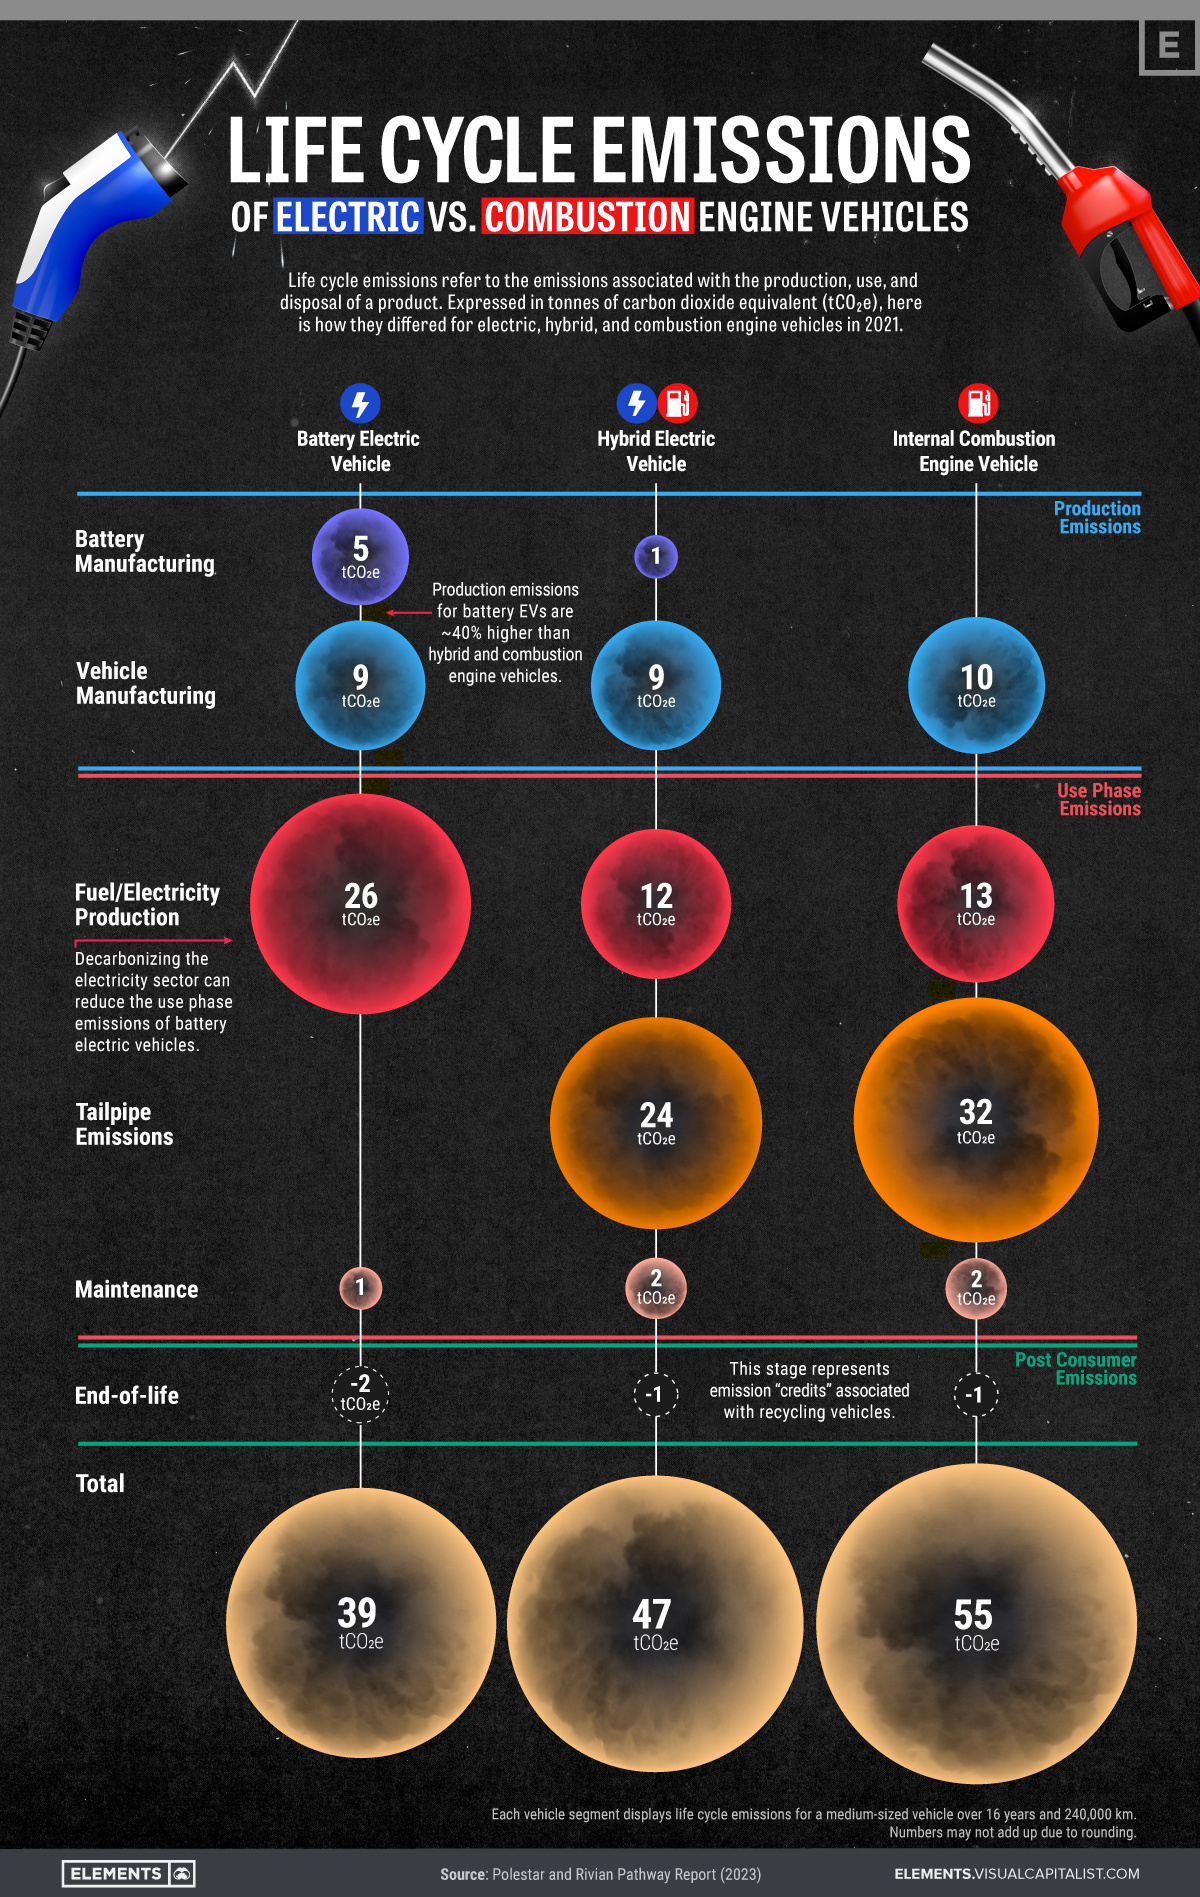
Life Cycle Emissions: EVs vs. Combustion Engine Vehicles
Battery electric vehicles (BEVs) have fewer lifecycle emissions than hybrid and internal combustion engine (ICE) cars, but a significant amount are still emitted during the manufacturing and electricity production stages of the BEVs. Life cycle emissions are the full amount of greenhouse gases emitted throughout a vehicle’s life, including production, use and disposal. The data was compiled by visualisation company Visual Capitalist using a Polestar and Rivian Pathway Report.
Read details below
Читать полностью…
Venture Capital
12 December 2023 19:00
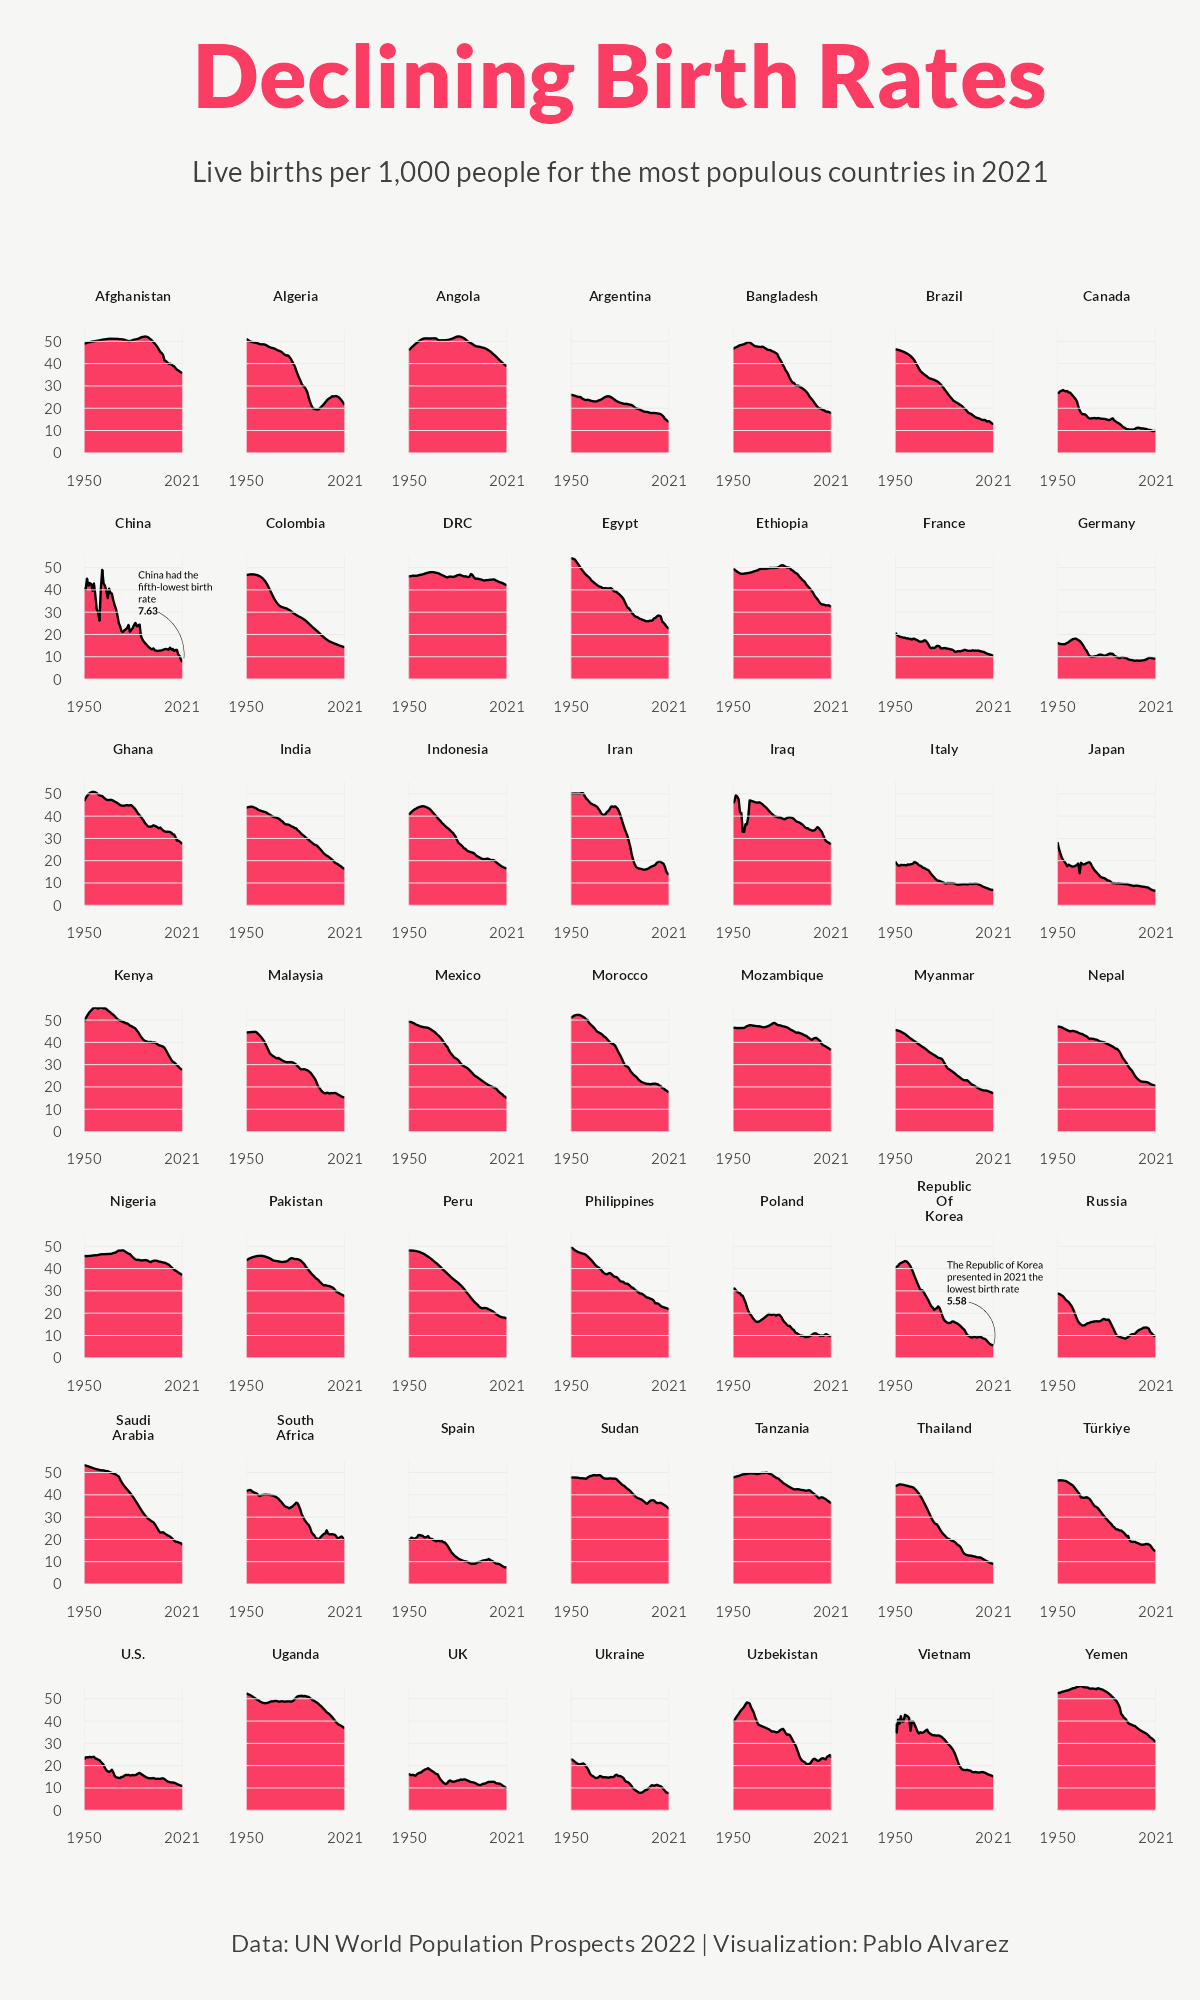
Charted: The Rapid Decline of Global Birth Rates
The world's population growth is shrinking, with declining birth rates a result of plummeting fertility rates, according to Visual Capitalist. Birth rates are commonly measured with the crude birth rate (CBR) metric, which records the number of live births per 1,000 people in a given population during a year. Every country in the top 49 across the globe has seen a decline in birth rates in the last 70 years, with some declines more staggering than others.
Read details below
Читать полностью…
Venture Capital
12 December 2023 11:00
I JUST CAME ACROSS THE BIGGEST PROJECT ON THE ETHEREUM NETWORK THIS YEAR
SANTA INU HAS THE BIGGEST AIRDROP UPCOMING
TO BE ELIGIBLE
JOIN TELEGRAM GROUP AND BE ACTIVE @
JOIN @
FOLLOW ON TWITTER AND DROP YOUR ETHEREUM ADDRESS UNDER THEIR POSTS
https://x.com/santacoinu/status/1734083561567768683?s=46&t=XkqKjOqg6_pQuj3bHVmWVg
DO NOT FADE THIS PROJECT. THE AIRDROP WILL BLOW YOUR MINDS.
SUPER BULLISH!
JOIN COMMUNITY
Website: https://santainu.net
Twitter Twitter.com/santacoinu
Telegram: /channel/Santacoininu
Читать полностью…
Venture Capital
11 December 2023 12:00
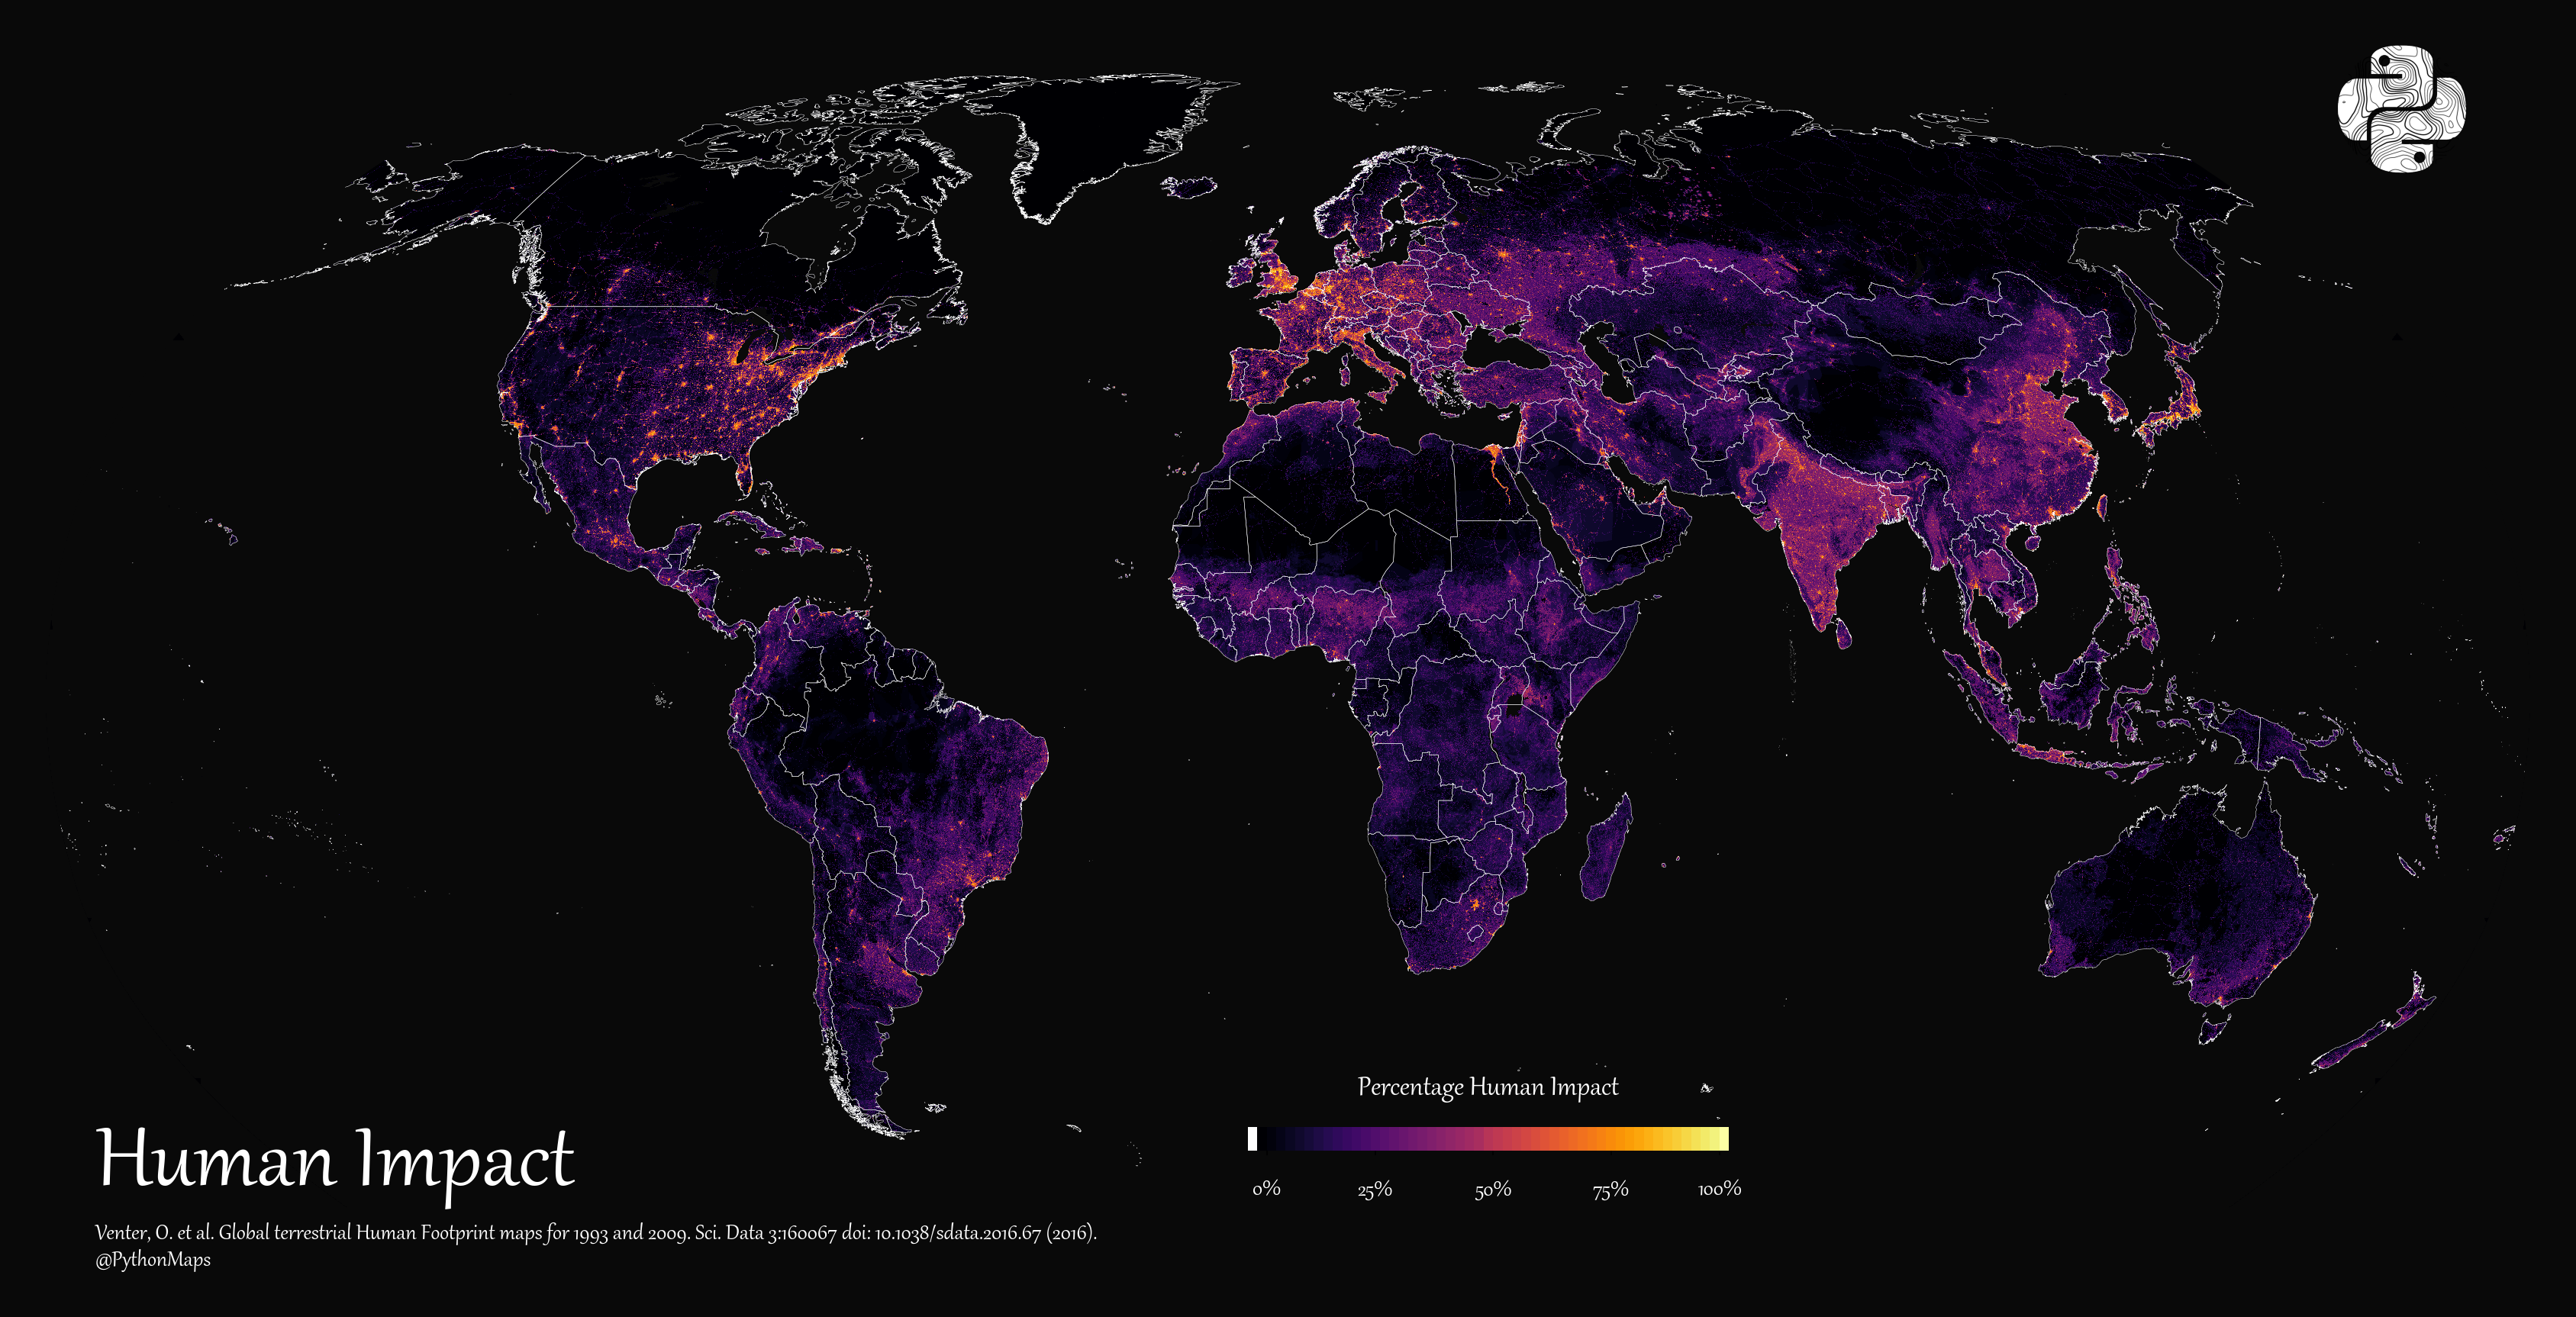
Mapping Human Impact Across the World
A new study has measured the extent of humanity's impact on the world between 1993 and 2009, using eight key variables including power infrastructure, croplands and population density. The satellite-based survey revealed that humanity's footprint increased the most in the densest urban centres, with America, north and central Asia, Europe and south-east Asia most impacted. The Arctic had very little alteration, but the Amazon rainforest, the Sahara desert, the Tibetan plateau and Western Australia's desert also had untouched areas.
Read details below
Читать полностью…
Venture Capital
10 December 2023 14:00
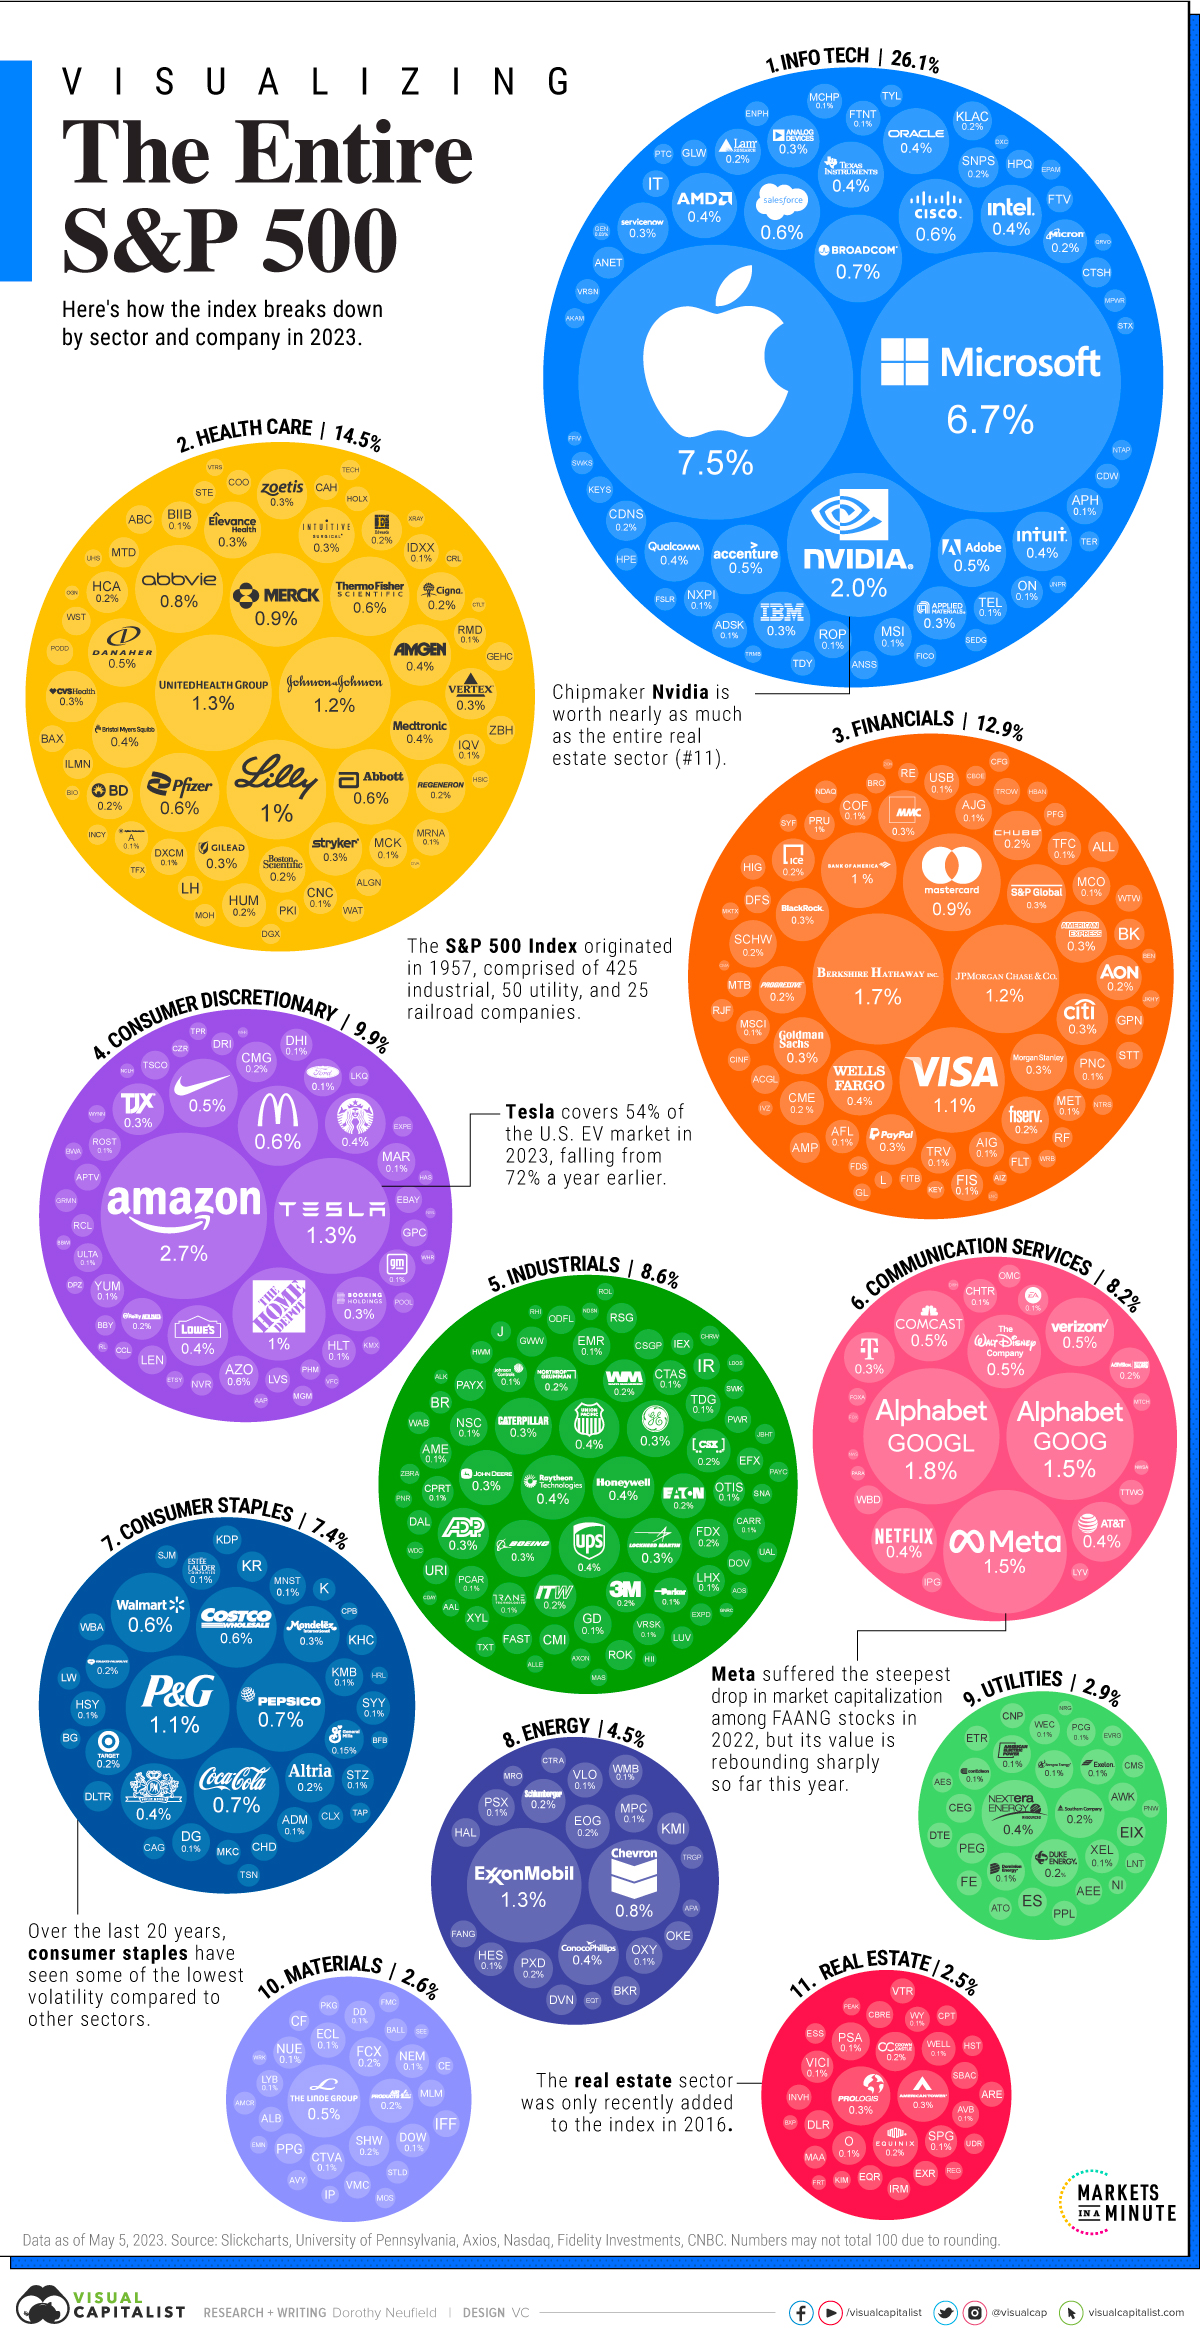
Visualizing Every Company on the S&P 500 Index
The S&P 500 is driving virtually all of the US index's gains, led by seven big tech companies: Apple, Microsoft, Nvidia, Google, Tesla, Meta and Amazon. These firms have seen double or triple-digit returns so far this year, with tech sector ETFs seeing $8bn in inflows as of 31 May, say reports. Companies in the S&P 500 boast $7.1tn in assets and account for almost four-fifths of available market capitalisation on US stock exchanges.
Read details below
Читать полностью…
Venture Capital
09 December 2023 12:00
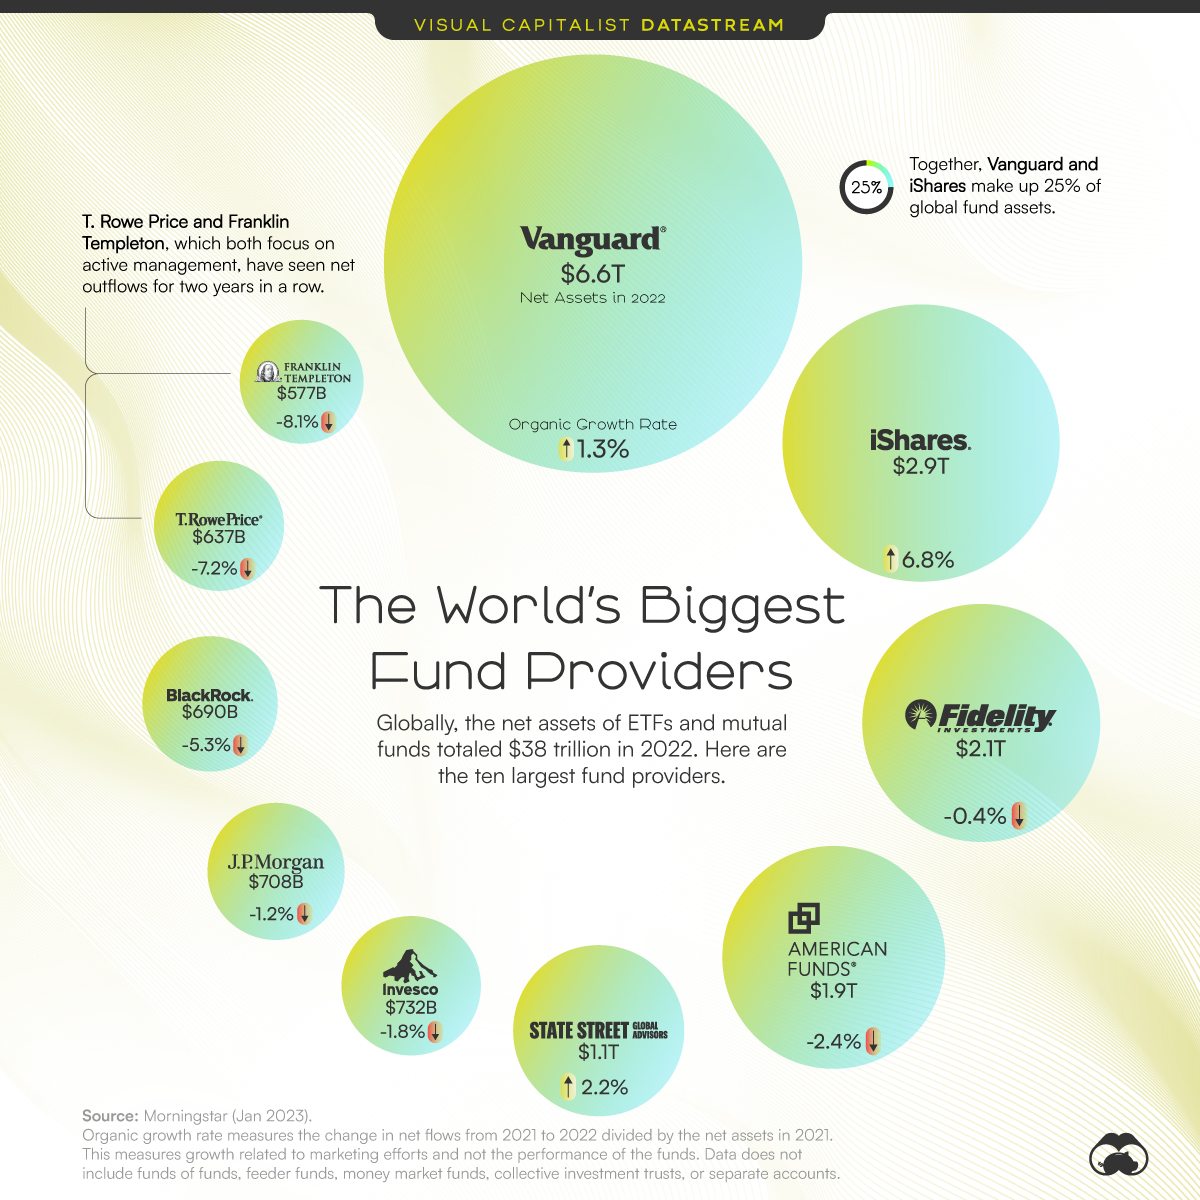
The World’s Biggest Mutual Fund and ETF Providers
Global net assets of mutual fund and ETF providers reached a record $38tn in 2022. The sector is dominated by a small number of companies, with Vanguard and iShares accounting for 25% of global mutual fund and ETF net assets, according to Morningstar. Both companies saw net inflows, but iShares' growth rate was much higher. The trend toward passive funds over mutual and active funds continued in 2022 and is driving consolidation in the industry.
Read details below
Читать полностью…
Venture Capital
08 December 2023 12:00
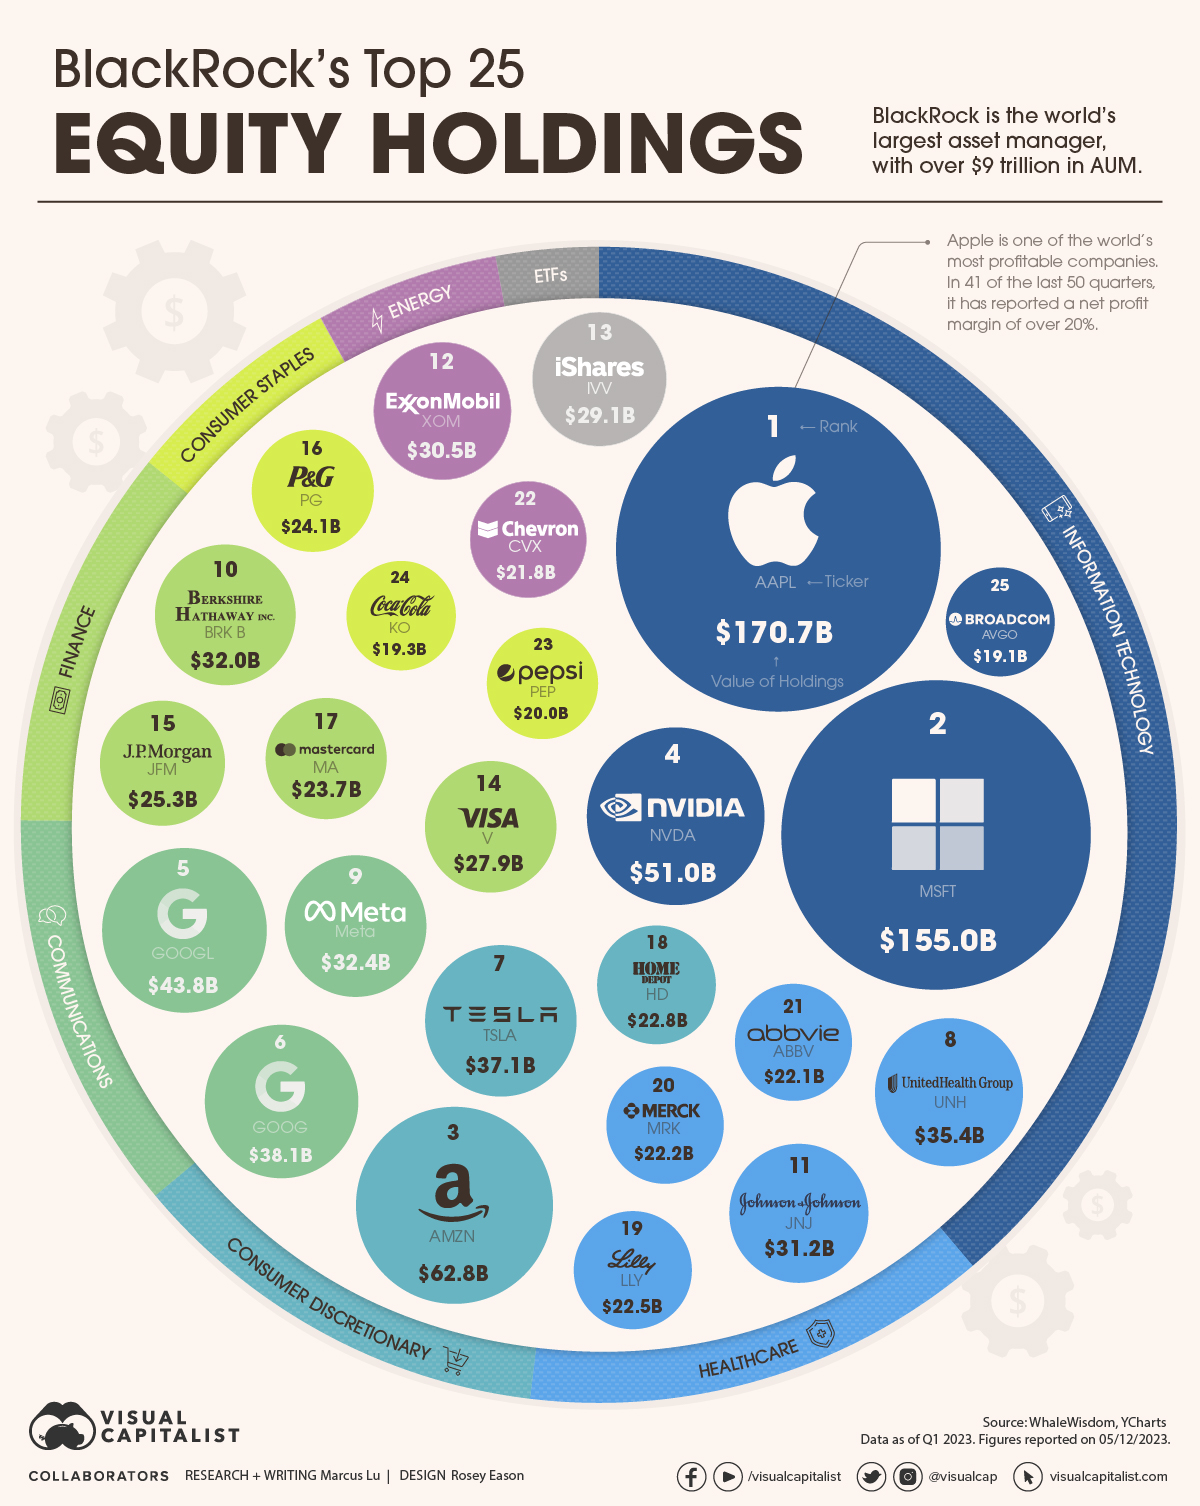
Visualizing BlackRock’s Top Equity Holdings
BlackRock's top 25 equity holdings as of Q1 2023, worth over $1tn and representing about 30% of BlackRock’s overall equity portfolio, include the largest technology companies in the US: Apple, Microsoft, Amazon, and Alphabet. The asset manager's portfolio also features major positions in Nvidia and Broadcom, the US's two largest semiconductor companies, with the former's incredible YTD performance pushing BlackRock's stake in the firm even higher. In total, tech stocks represent 39% of the top 25, the next biggest sector of which is healthcare, making up 13% of the total.
Read details below
Читать полностью…
Venture Capital
07 December 2023 12:00
The Top Feeder Schools into Silicon Valley
Silicon Valley is one of the largest and most prominent tech hubs in the world. It accounts for about one-third of America’s national investment capital and it houses the headquarters of over 30 companies in the Fortune 1000.
Given its world-class reputation, it’s the dream of many tech workers to land a job in a Silicon Valley company. But what’s the best route for getting there?
While there is certainly no clear-cut path, one way to try and answer this question is by looking at the universities and colleges that Silicon Valley employees graduate from.
Read details below
Читать полностью…
Venture Capital
06 December 2023 18:00
🚨 Last call – crypto bull market is about to begin.
Bitcoin is preparing for the 2024 rally, leaving less time to enter at favorable prices.
If you don't want to miss it, follow experienced traders like SZ from Hong Kong. Using his own trading strategy, he identifies the most profitable coins and shares them with his followers.
Join now and see for yourself - /channel/+YQ6Yz3gLlaMwNjEy
Читать полностью…
Venture Capital
05 December 2023 19:00
All the Contents of the Universe, in One Graphic
Scientists agree that the universe consists of three distinct parts: everyday visible (or measurable) matter, and two theoretical components called dark matter and dark energy.
These last two are theoretical because they have yet to be directly measured—but even without a full understanding of these mysterious pieces to the puzzle, scientists can infer that the universe’s composition can be broken down.
Read details below
Читать полностью…
Venture Capital
04 December 2023 19:00
How Big Tech Revenue and Profit Breaks Down, by Company
In the media and public discourse, companies like Alphabet, Apple, and Microsoft are often lumped together into the same “Big Tech” category. After all, they constitute the world’s largest companies by market capitalization.
And because of this, it’s easy to assume they’re in direct competition with each other, fiercely battling for a bigger piece of the “Big Tech” pie. But while there is certainly competition between the world’s tech giants, it’s a lot less drastic than you might imagine.
This is apparent when you look into their various revenue streams, and this series of graphics by Truman Du provides a revenue breakdown of Alphabet, Amazon, Apple, and Microsoft.
Read details below
Читать полностью…
Venture Capital
03 December 2023 19:02
The Shrinking Trillion Dollar Market Cap Club
Aggressive tightening from the Federal Reserve has caused tech stocks to plummet back to Earth in 2022, and this has shaken up the membership of the trillion dollar market cap club.
Apple, Microsoft, and Aramco are all still well above the $1 trillion mark for now, but Alphabet’s trajectory could take it out of this list if circumstances don’t change soon. Google has indicated that the decrease in crypto advertising has had a big impact on revenue, and ad budgets continue to be slashed as economic uncertainty continues.
Read details below
Читать полностью…
Venture Capital
01 December 2023 19:00
How Do Americans Spend Their Money, By Generation?
In 2021, the average American spent just over $60,000 a year. But where does all their money go? Unsurprisingly, spending habits vary wildly depending on age.
This graphic by Preethi Lodha uses data from the U.S. Bureau of Labor Statistics to show how average Americans spend their money, and how annual expenses vary across generations.
Read details below
Читать полностью…
Venture Capital
30 November 2023 19:00
Visualizing U.S. Interest Rates Since 2020
In March 2020, the U.S. Federal Reserve cut already depressed interest rates to historic lows amid an unraveling COVID-19 pandemic.
Fast-forward to 2022, and the central bank is grappling with a very different economic situation that includes high inflation, low unemployment, and increasing wage growth. Given these conditions, it raised interest rates to 2.25% up from 0% in just five months.
The above visualization from Jan Varsava shows U.S. interest rates over the last two years along with its impact on Treasury yields, often considered a key indicator for the economy.
Read details below
Читать полностью…
Venture Capital
14 December 2023 12:00
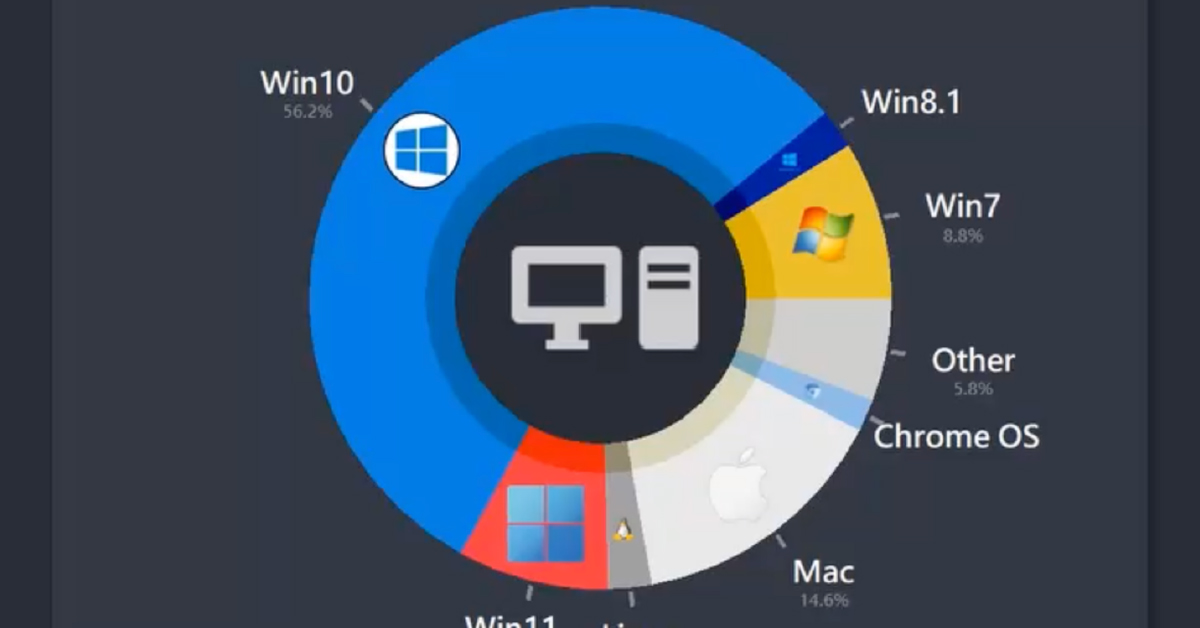
Animated: Most Popular Desktop Operating Systems Since 2003
An animated chart created by Sjoerd Tilmans illustrates the rise and fall of desktop operating systems (OS) from May 2003 to June 2022, using data from W3Schools and GS Stat Counter. Microsoft started as the dominant force in the 1990s and early 2000s with the launch of different versions of Windows. The most recent release, Windows 11, received a slow uptake compared to Windows 10 with just an 8.3% market share by June 2022.
Read details below
Читать полностью…
Venture Capital
13 December 2023 12:00
Charting the Rise of Cross-Border Money Transfers (2015-2023)
The remittance industry has been consistently growing over the past few years, with the transfer of money between countries playing a key role in supporting dependent communities. This is particularly true in low and middle-income countries, where, in general, 79% of remittance payments are received. India leads the way in this field as the country that receives the most remittance payments globally. With this growth in the industry, it is important to note the part that innovative transfer operators, such as Wise, have played in its development.
Read details below
Читать полностью…
Venture Capital
12 December 2023 12:00
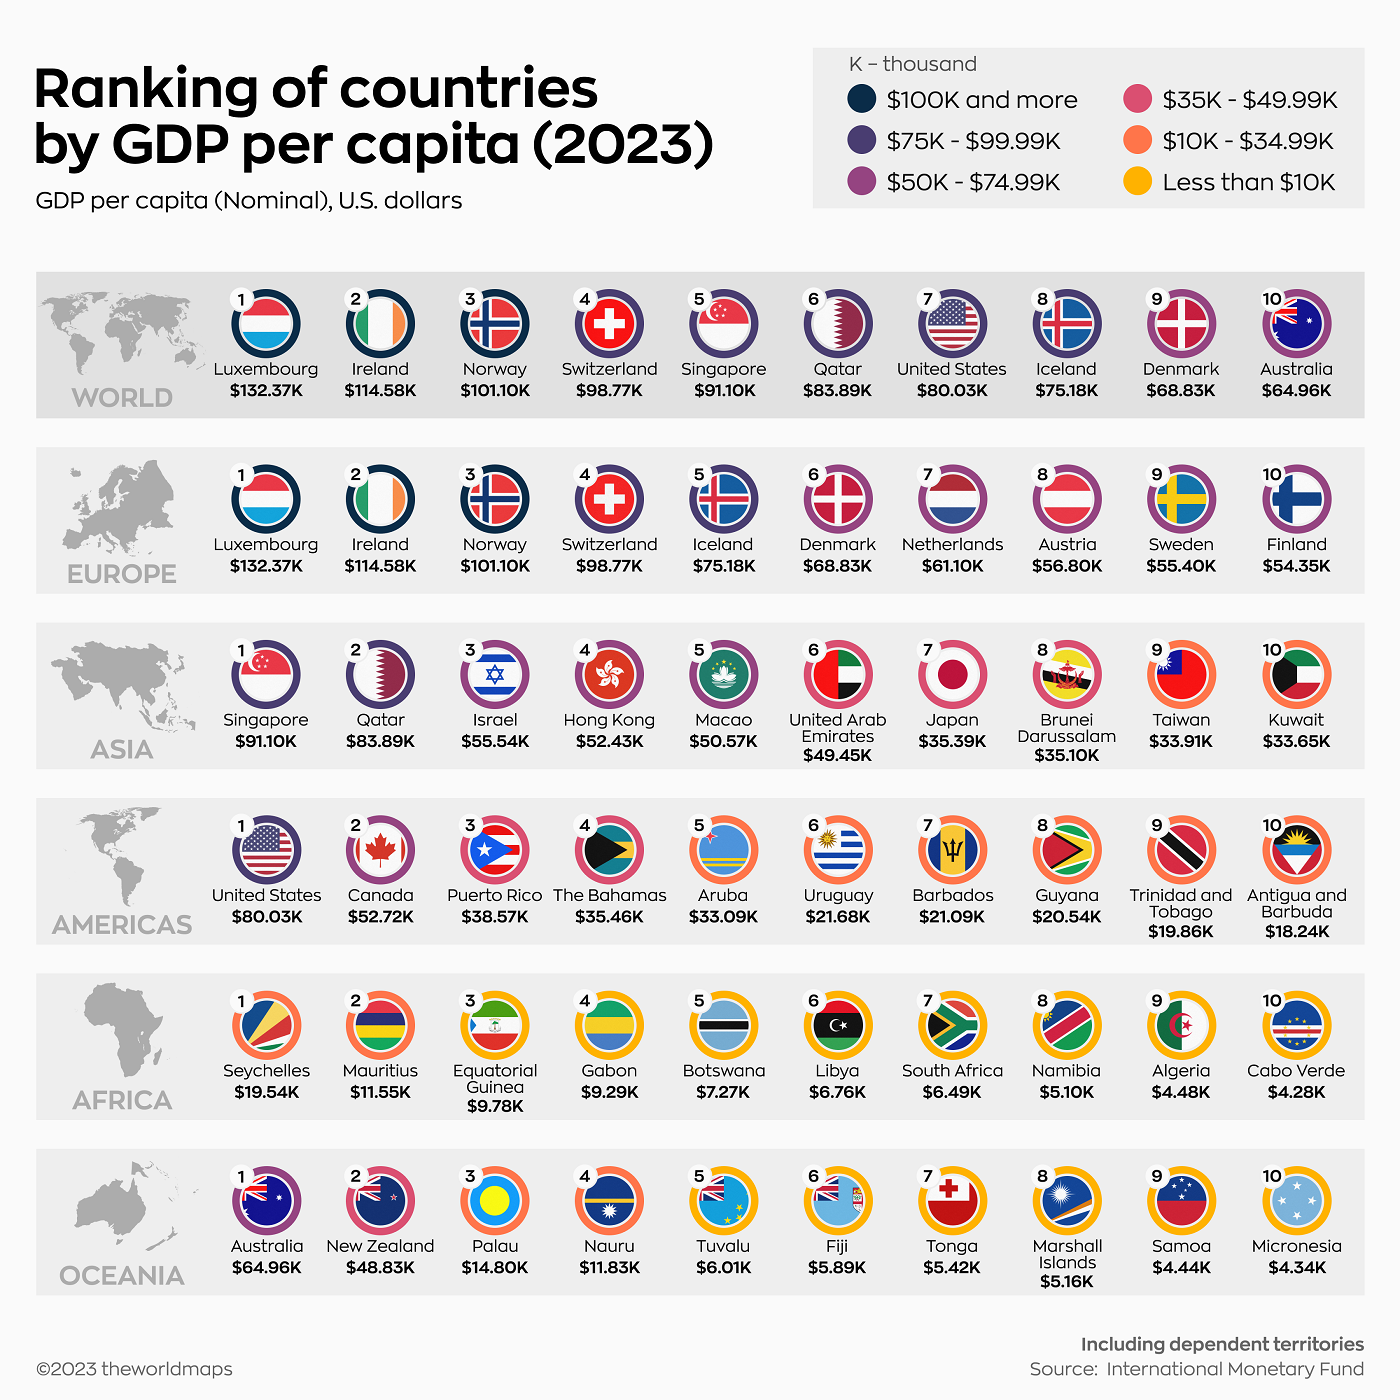
Top 10 Countries By GDP Per Capita, by Region
Luxembourg, Ireland, and Norway lead the ranking of the top 10 countries by nominal GDP per capita in the world in 2023, measured in US dollars, according to data from the International Monetary Fund (IMF). Wealthy countries with smaller populations tend to make up the world’s richest ranks. One of the major drawbacks of using GDP per capita is that it doesn’t account for the strength of the local currency versus its exchange rate. To solve this problem, economists utilise purchasing power parity (PPP) indexes.
Read details below
Читать полностью…
Venture Capital
11 December 2023 19:00
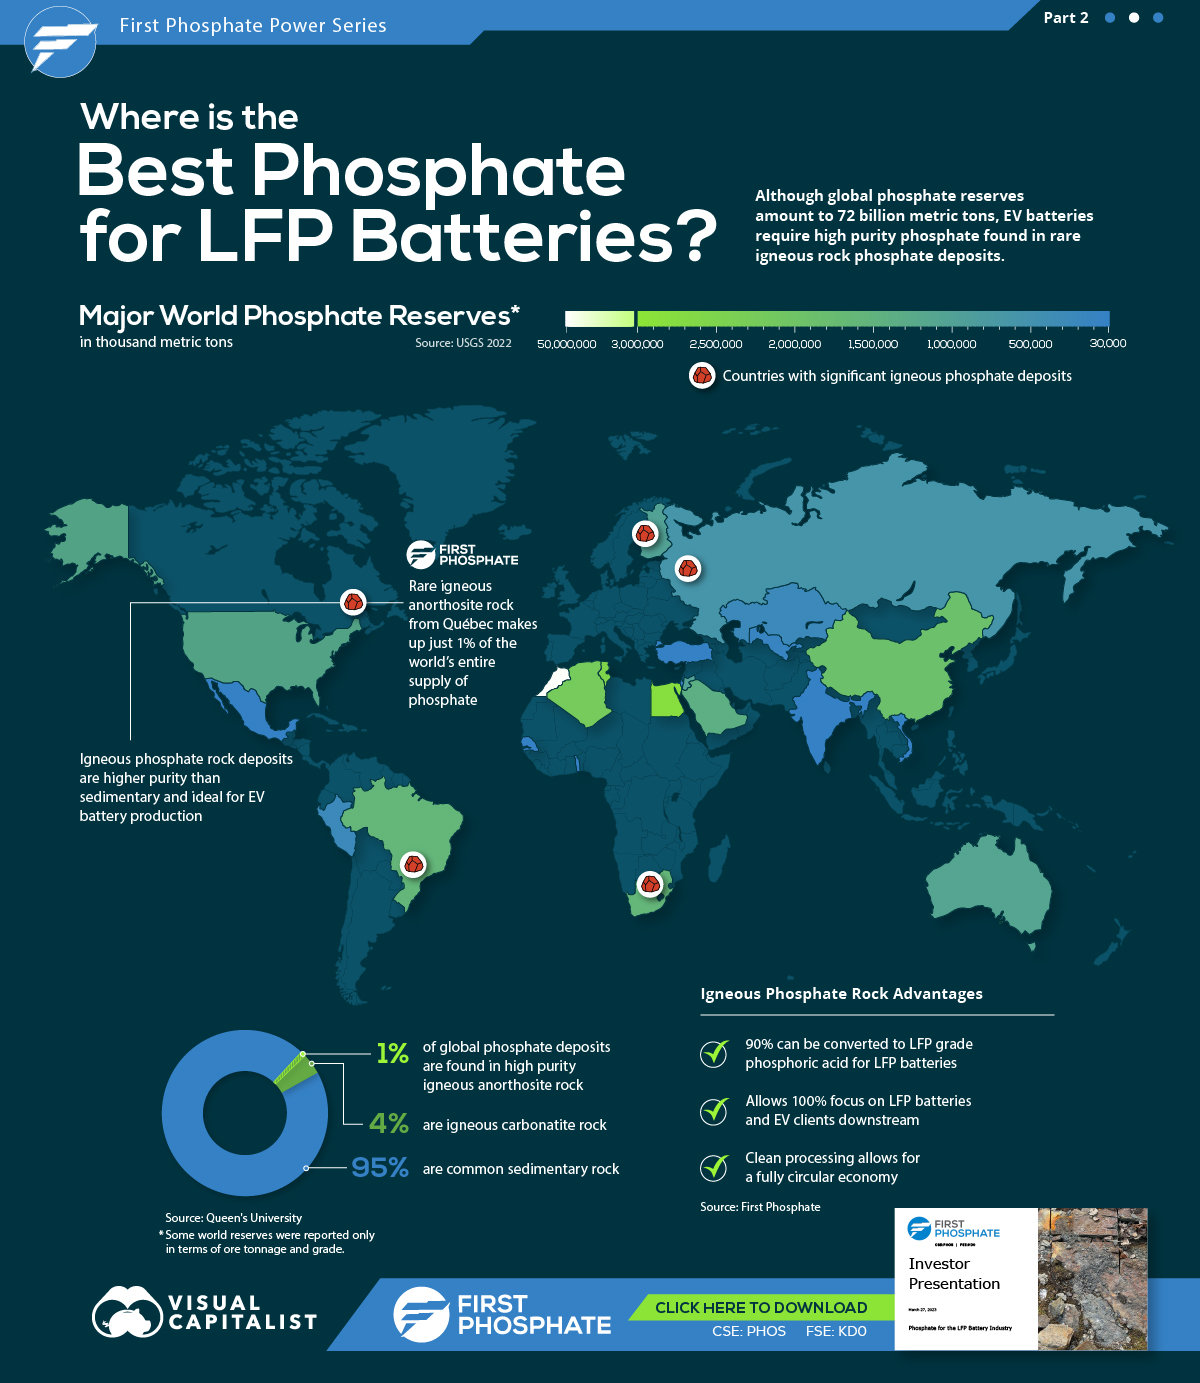
Mapped: Where is the Best Phosphate For LFP Batteries?
A new infographic sponsored by First Phosphate presents the global deposit of phosphate needed for the production of lithium iron phosphate (LFP) batteries for electric vehicles (EVs). While global phosphate reserves stand at 72 billion metric tons, high-purity phosphate commonly required by EV batteries is often only found in rare igneous rock phosphate deposits. Morocco accounts for 70% of the world's phosphate reserves. However, significant igneous phosphate deposits are only found in Brazil, Canada, Finland, Russia, and South Africa.
Read details below
Читать полностью…
Venture Capital
10 December 2023 19:00
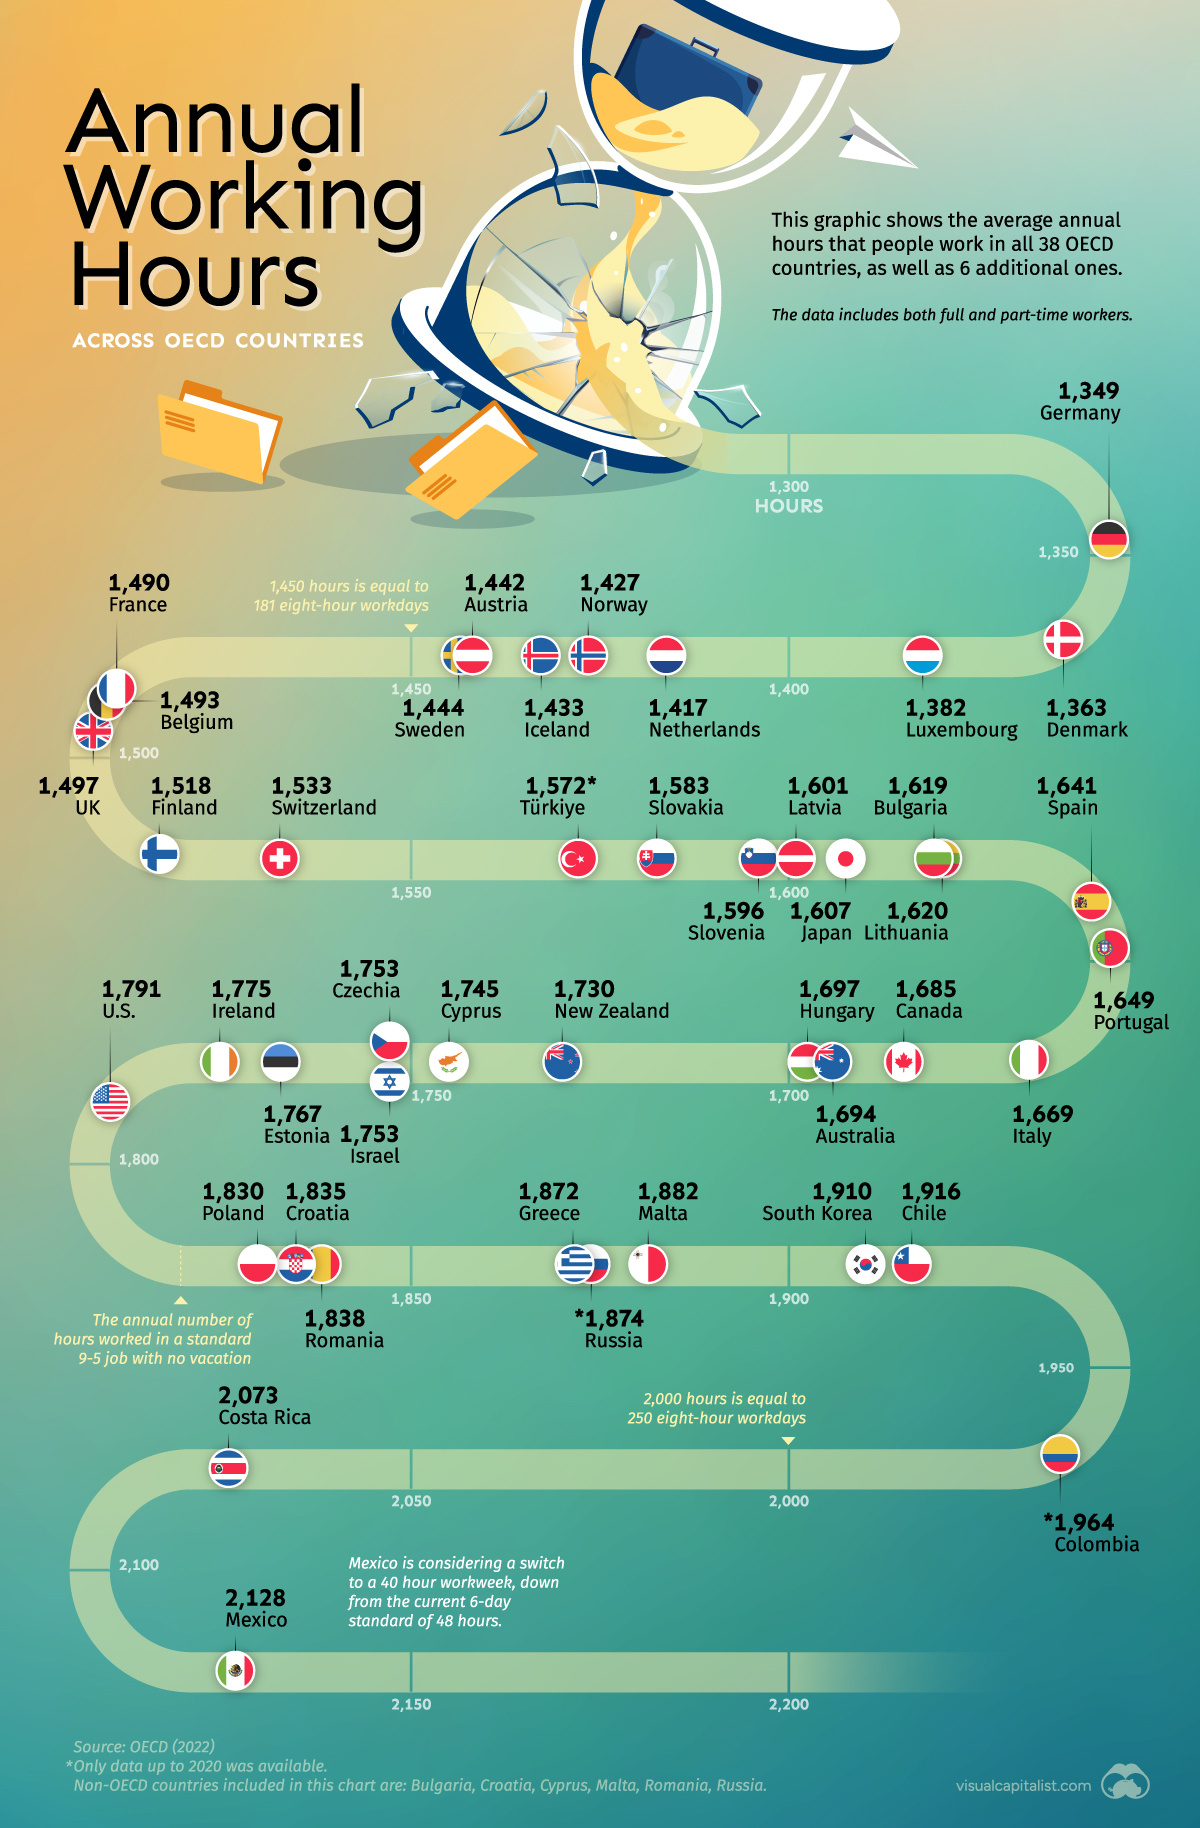
Visualizing Annual Working Hours in OECD Countries
Mexico has the longest working hours in the 37-member Organisation for Economic Cooperation and Development and Colombia, Turkey and Russia are among those exceeding a 40-hour week, according to the OECD. Its members include many of the most advanced economies in the world. Mexicans worked an average of 2,148 hours in 2018, compared to the OECD average of 1,760. Among OECD nations, Germany has the shortest working hours at 1,363, or just under 26 hours a week, while Denmark is second with 1,412.3 hours, or just over 27 hours.
Read details below
Читать полностью…
Venture Capital
09 December 2023 19:00
Artificial Intelligence: The Journey to a Thinking Machine
Artificial intelligence (AI) has disrupted all aspects of life and work, with language model ChatGPT reaching 100 million active monthly users in just two months, making it the fastest-growing consumer application in history. Goldman Sachs predicted that AI could add 7% to global GDP over a 10-year period, almost $7tn, but also replace 300 million jobs in the process.
Read details below
Читать полностью…
Venture Capital
08 December 2023 19:00
Can You Calculate Your Daily Carbon Footprint?
Canadian clean energy investment firm Carbon Streaming aims to encourage individuals to reduce their carbon footprint by buying the high-quality offset credits that fund its projects. Carbon credits enable consumers to invest in environmentally sustainable projects, such as carbon capture or reforestation, to offset their own carbon emissions, something only 3% of US climate-conscious Americans have purchased, according to a Boston Consulting Group survey. By purchasing credits from Carbon Streaming, consumers can fund its work and reduce their own carbon footprint in the process.
Read details below
Читать полностью…
Venture Capital
07 December 2023 19:00
All of the World’s Spaceports on One Map
From Sputnik 1 to today’s massive satellite constellations, every object in space was launched from just a handful of locations.
The map above, from BryceTech, is a comprehensive look at the world’s spaceports (both orbital and sub-orbital) as well as ballistic missile test sites.
Read details below,
Читать полностью…
Venture Capital
06 December 2023 19:00
The Elemental Composition of the Human Body
The human body is a miraculous, well-oiled, and exceptionally complex machine. It requires a multitude of functioning parts to come together for a person to live a healthy life—and every biological detail in our bodies, from the mundane to the most magical, is driven by just 21 chemical elements.
Of the 118 elements on Earth, just 21 of them are found in the human body. Together, they make up the medley of divergent molecules that combine to form our DNA, cells, tissues, and organs.
Based on data presented by the International Commission on Radiological Protection (ICRP), in the above infographic, we have broken down a human body to its elemental composition and the percentages in which they exist.
Read details below
Читать полностью…
Venture Capital
06 December 2023 12:00
The Basics of DNA and Genetic Systems
While there is great diversity among living things, we all have one thing in common—we all rely on a genetic system made up of DNA and/or RNA.
But how do genetic systems work, and to what extent do they vary across species?
This graphic by Anne-Lise Paris explores the basics of DNA and genetic systems, including how they’re structured, and how they differ across species.
Read details below
Читать полностью…
Venture Capital
05 December 2023 12:00
Visualizing the Evolution of Vision and the Eye
Throughout history, numerous creatures have evolved increasingly complex eyes in response to different selective pressures.
Not all organisms, however, experience the same pressures. It’s why some creatures today still have eyes that are quite simple, or why some have no eyes at all. These organisms exemplify eyes that are “frozen” in time. They provide snapshots of the past, or “checkpoints” of how the eye has transformed throughout its evolutionary journey.
Scientists study the genes, anatomy, and vision of these creatures to figure out a roadmap of how the eye came to be. And so, we put together an evolutionary graphic timeline of the eye’s different stages using several candidate species.
Read details below
Читать полностью…
Venture Capital
04 December 2023 12:00
33 Problems With Media in One Chart
One of the hallmarks of democratic society is a healthy, free-flowing media ecosystem.
In times past, that media ecosystem would include various mass media outlets, from newspapers to cable TV networks. Today, the internet and social media platforms have greatly expanded the scope and reach of communication within society.
Of course, journalism plays a key role within that ecosystem. High quality journalism and the unprecedented transparency of social media keeps power structures in check—and sometimes, these forces can drive genuine societal change. Reporters bring us news from the front lines of conflict, and uncover hard truths through investigative journalism.
Read details below
Читать полностью…
Venture Capital
02 December 2023 12:00
The Biggest Donors of the 2022 U.S. Midterm Elections
This year’s midterm election is expected to set a new spending record, with over $9 billion being raised. This is significantly higher than the previous record of $7 billion, which was set in 2018.
According to a recent analysis by the Washington Post, $1 billion of these funds can be attributed to the top 50 donors. In typical Visual Capitalist style, we’ve illustrated this data to provide you with better insight.
Read details below
Читать полностью…
Venture Capital
01 December 2023 12:00
Gen Z’s Favorite Brands, Compared with Older Generations
Generation Z’s favorite brands, in absolute terms, aren’t wildly different from preferences of other generations, with Walmart, Google, and Netflix ranking high. But when it comes to the brands that do the best with Gen Z compared to their elders, the list shakes up dramatically.
This ranking uses consumer preference data from Morning Consult to show which brands are favored considerably more by Gen Z when compared to the general public. A brand’s rank is determined by the difference in favorability between Gen Z’s survey responses and the average of all U.S. adult respondents.
Read details below
Читать полностью…
Venture Capital
30 November 2023 12:00
Visualizing S&P 500 Performance in 2022, by Sector
Tracking indexes over the course of a year reveals a lot about market trends and sentiment. The S&P 500’s performance over the course of 2022 is a great example.
Throughout the year, inflation rates have remained high and interest rates have likewise been climbing around the world. Accompanied by the looming threat of a recession, some sectors have been hit harder than others.
The above visualization from Jan Varsava shows U.S. dividend-adjusted stock performance for each company in the S&P 500 index in 2022, from the start of the year through the end of September.
Read details below
Читать полностью…


 3011743