Venture Capital
29 декабря 2023 12:00
Mapped: The Safest Cities in the U.S.
The article discusses the safest cities in the US, based on FBI data and Census Bureau populations from 2023. The ranking only includes cities with a population of 25,000 or higher and is based on total index crimes reported, including arson, burglary, larceny-theft, motor vehicle theft, murder, rape, armed robbery, and aggravated assault. The top 100 cities on the list have a median population of just 32,000, and many of them are located in the Northeastern states.
Read details below
Читать полностью…
Venture Capital
28 декабря 2023 13:38
The most profitable and free crypto community in telegram.
The channel is run by a trader with 5 years of experience. He earned over $300,000 in a year exclusively on the spot, all his actions are published in his channel for FREE🫣
He also shares a daily plan for Bitcoin movement and spot signals for alts.
❗️I will delete the link soon, subscribe:
/channel/+vgpf8LHfv7djMGQ6
Читать полностью…
Venture Capital
27 декабря 2023 19:00
Mapped: The Most Dangerous Cities in the U.S.
According to new per capita data from NeighborhoodScout, some of the most dangerous cities in the US are actually smaller or suburban cities. The data uses the latest FBI crime data and Census Bureau populations for 2023, and the focus is on violent crimes such as armed robbery, murder, rape, and aggravated assault. The top three most dangerous cities are Bessemer, Mobile, and Birmingham, all of which are in Alabama. Memphis and Detroit are the largest cities to appear in the top 10.
Read details below
Читать полностью…
Venture Capital
26 декабря 2023 19:00
Charted: Changing Sentiments Towards AI in the Workplace
According to a recent survey by Boston Consulting Group (BCG), workers' sentiments towards AI in the workplace have significantly evolved over the past five years. The survey, which polled 13,000 C-suite leaders, managers, and frontline employees in 18 different countries, revealed that curiosity about AI remains consistent at 60% since 2018. However, optimism about AI's impact on work has increased by 17 percentage points (p.p.) to over 50% of workers surveyed.
Read details below
Читать полностью…
Venture Capital
25 декабря 2023 19:00
Visualizing 1 Billion Square Feet of Empty Office Space
A record 963 million square feet of office space in America was unoccupied at the end of Q1 2023, according to data from JLL. Cities with the highest vacancy rates included New York, which had around 76 million square feet of empty office space, and Washington, D.C., with a vacancy rate 8% higher than what is considered healthy. San Francisco had the highest vacancy rate, exceeding 26%.
Read details below
Читать полностью…
Venture Capital
24 декабря 2023 19:00
Who’s Still Buying Russian Fossil Fuels in 2023?
Despite the decline in Russia's revenues from fossil fuel exports, many countries are still importing significant amounts of fossil fuels from Russia. The European Union (EU) has imported over $18 billion worth of crude oil and natural gas from Russia in 2023, despite a decline of over 90% since the peak. China remains Russia's top buyer, with imports reaching $30 billion up until June 2023. The EU, China, and India are the largest importers of Russian fossil fuels, with Turkey also importing over $10 billion worth.
Read details below
Читать полностью…
Venture Capital
23 декабря 2023 19:00
Industrial Automation: Who Leads the Robot Race?
According to a report by the International Federation of Robotics, China installed more industrial robots in 2021 than all other countries combined. 56% of China's installations were deployed in automotive or electronics-related industries. Japan and the United States also saw significant installations of industrial robots, with 53% and 36% respectively dedicated to automotive and electronics. The report suggests that automation can help address labor shortages, particularly in industries like agriculture and healthcare. The market for surgical robots is expected to reach over $20 billion by 2030.
Read details below
Читать полностью…
Venture Capital
22 декабря 2023 19:00
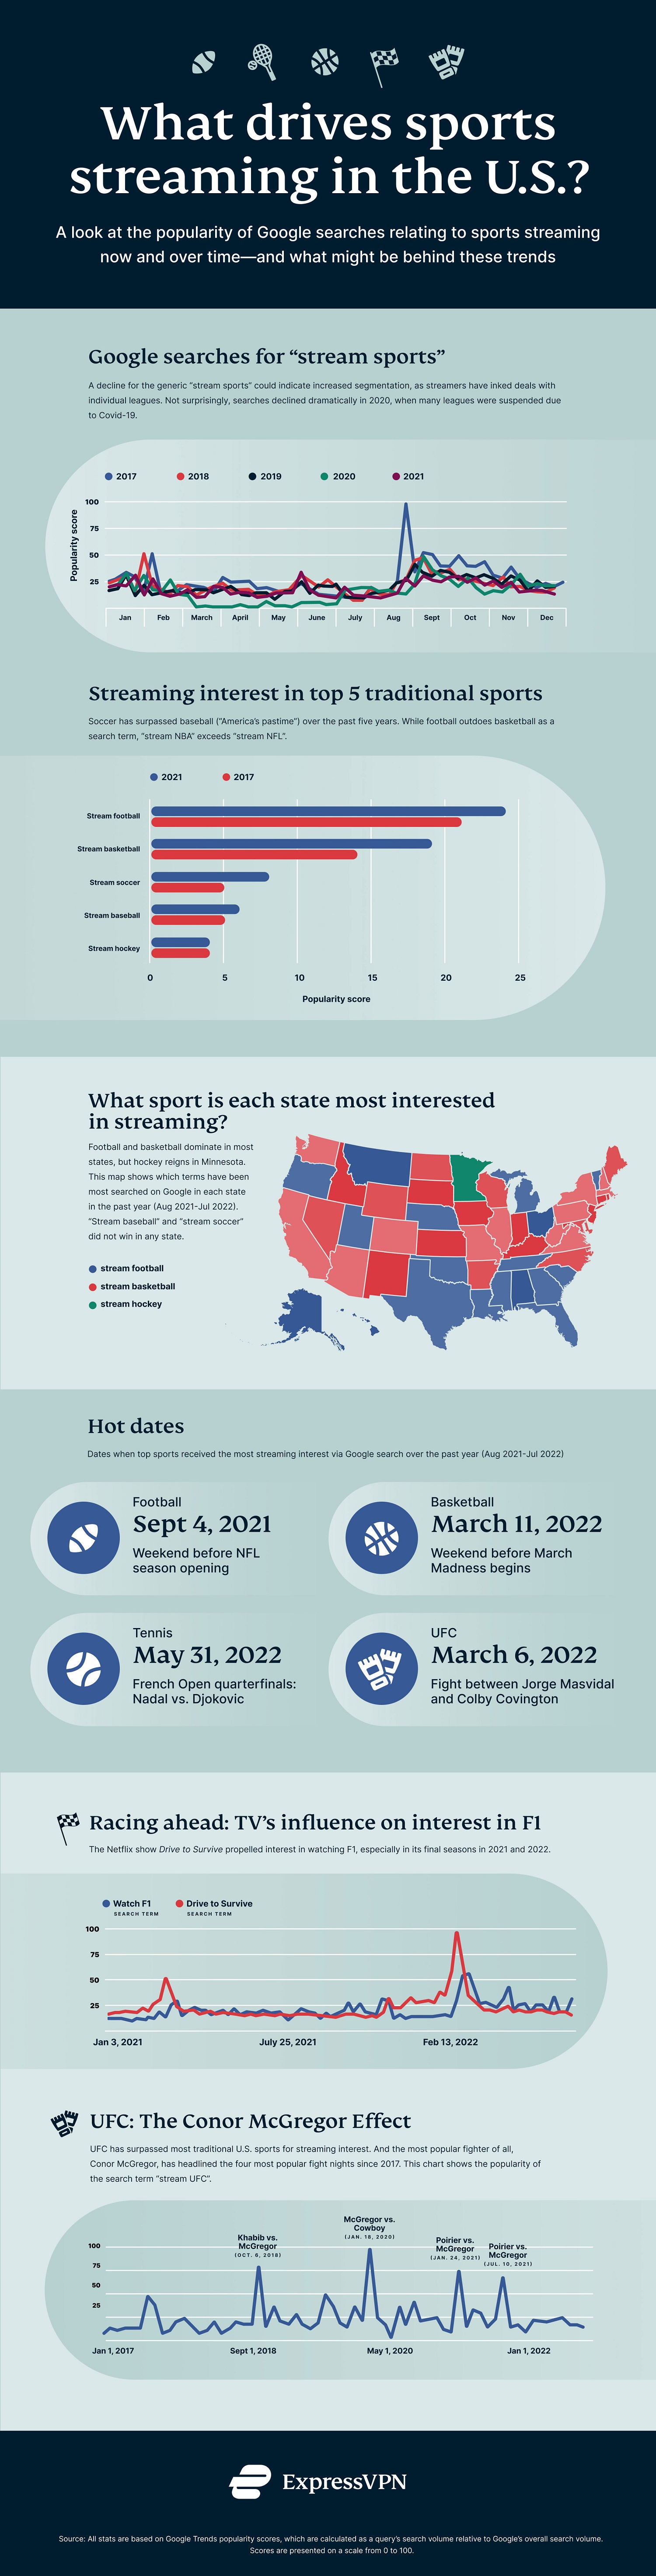
Sports Streaming Interest in the U.S. by State
The global streaming revolution is well underway, and sports streaming is no different. In 2022, 85% of Americans had a streaming account and 58% had more than one. And with old exclusive cable deals winding down, sports streaming interest has grown from both consumers and providers, including sports leagues, streamers, and cable providers. Examining the frequency of streaming sports queries reveals both important sporting events and the effects of COVID-19. From 2017 to 2021, some of the notable and recurring spikes in sports streaming interest occurred around the following dates...
Read details below
Читать полностью…
Venture Capital
21 декабря 2023 19:00
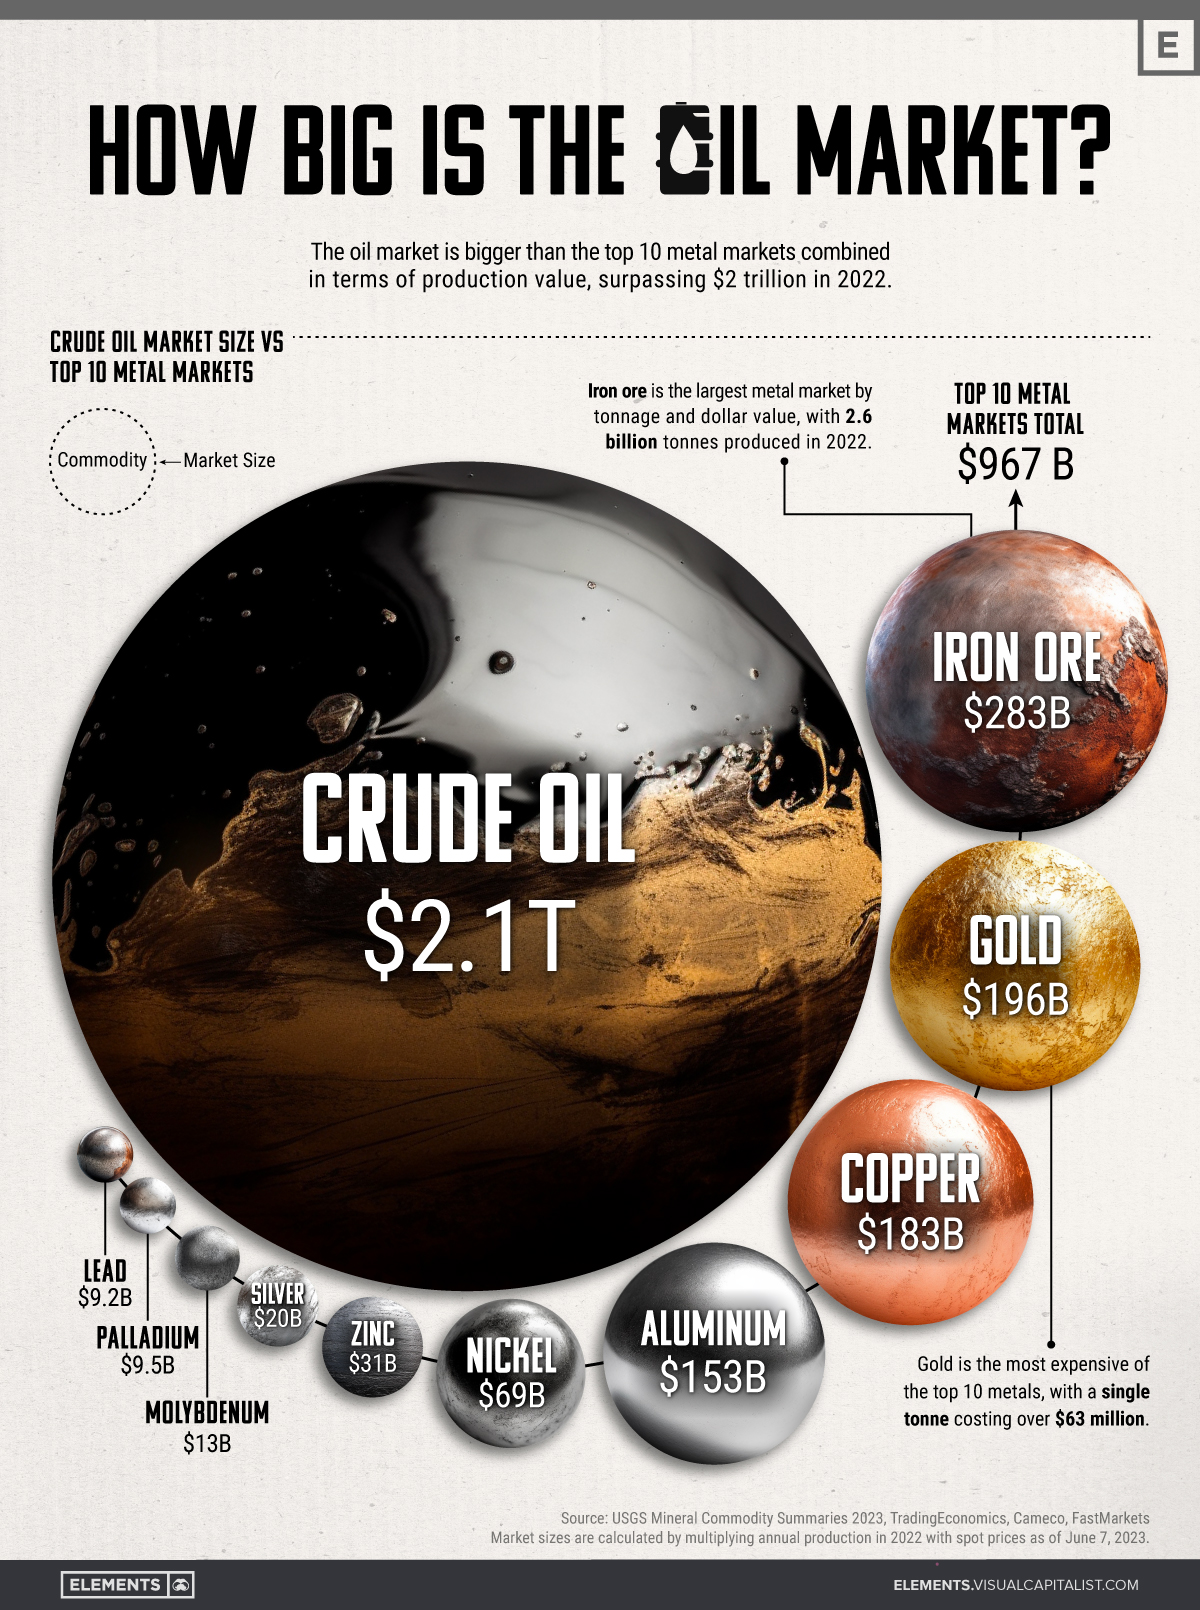
How Big is the Market for Crude Oil?
The crude oil market is the largest in the world. In 2022, the global production of crude oil averaged 80.75 million barrels per day, resulting in an annual production of 29.5 billion barrels. With current prices, the market size of crude oil exceeds $2 trillion. To put this into perspective, the combined market size of the 10 largest metal markets is only $967 billion, less than half that of the oil market.
Read details below
Читать полностью…
Venture Capital
20 декабря 2023 19:00
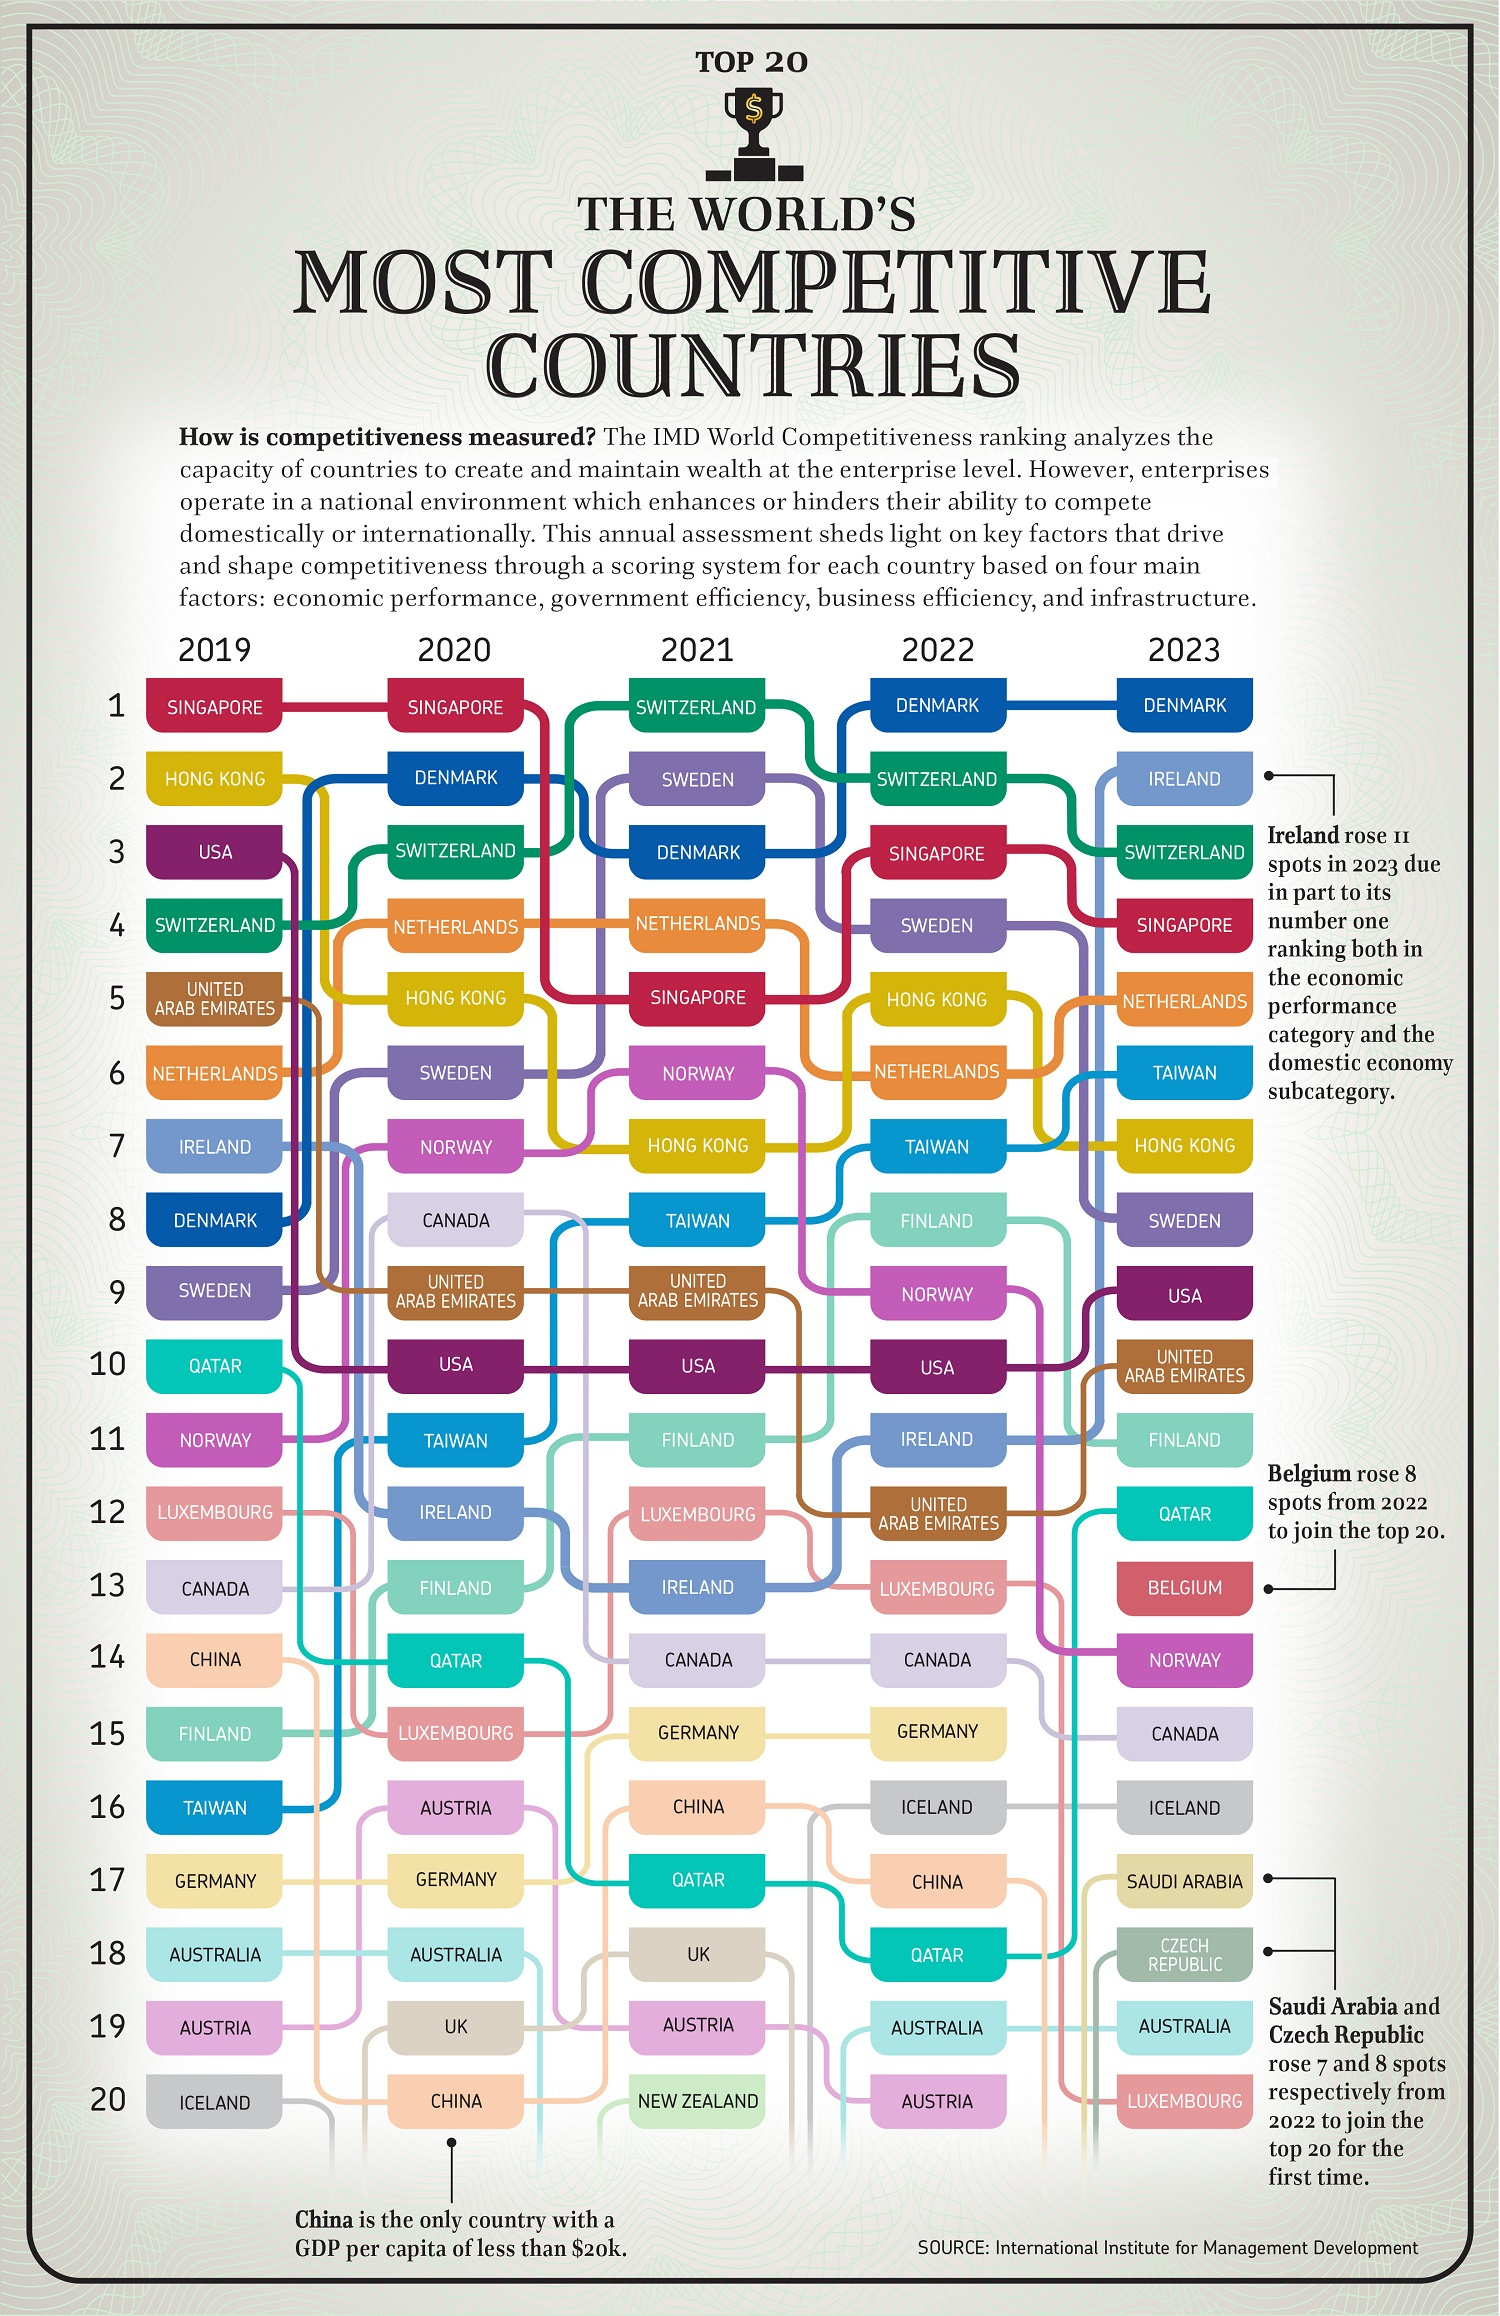
Ranked: The World’s Most Competitive Countries (2019-2023)
Denmark has retained its position as the most competitive country in the world, according to the World Competitiveness Ranking report by the International Institute for Management Development (IMD). The rankings are based on four metrics: economic performance, government efficiency, business efficiency, and infrastructure. Denmark excelled in all categories, particularly in business efficiency and government efficiency. Ireland jumped five spots since 2019 to claim the second position, while Switzerland came in third. Singapore, which was ranked the most competitive country in 2019 and 2020, secured fourth place.
Read details below
Читать полностью…
Venture Capital
19 декабря 2023 19:00
Fact or Fiction? Test Your Knowledge About Investing During a Recession
As the likelihood of a U.S. recession increases, it becomes important to understand how to invest during this period. The New York Federal Reserve estimates a 71% probability of a recession occurring within the next 12 months. A quiz from New York Life Investments aims to test investors' knowledge amid this economic uncertainty. One question in the quiz asks when the market low typically occurs during recessions.
Read details below
Читать полностью…
Venture Capital
18 декабря 2023 19:00
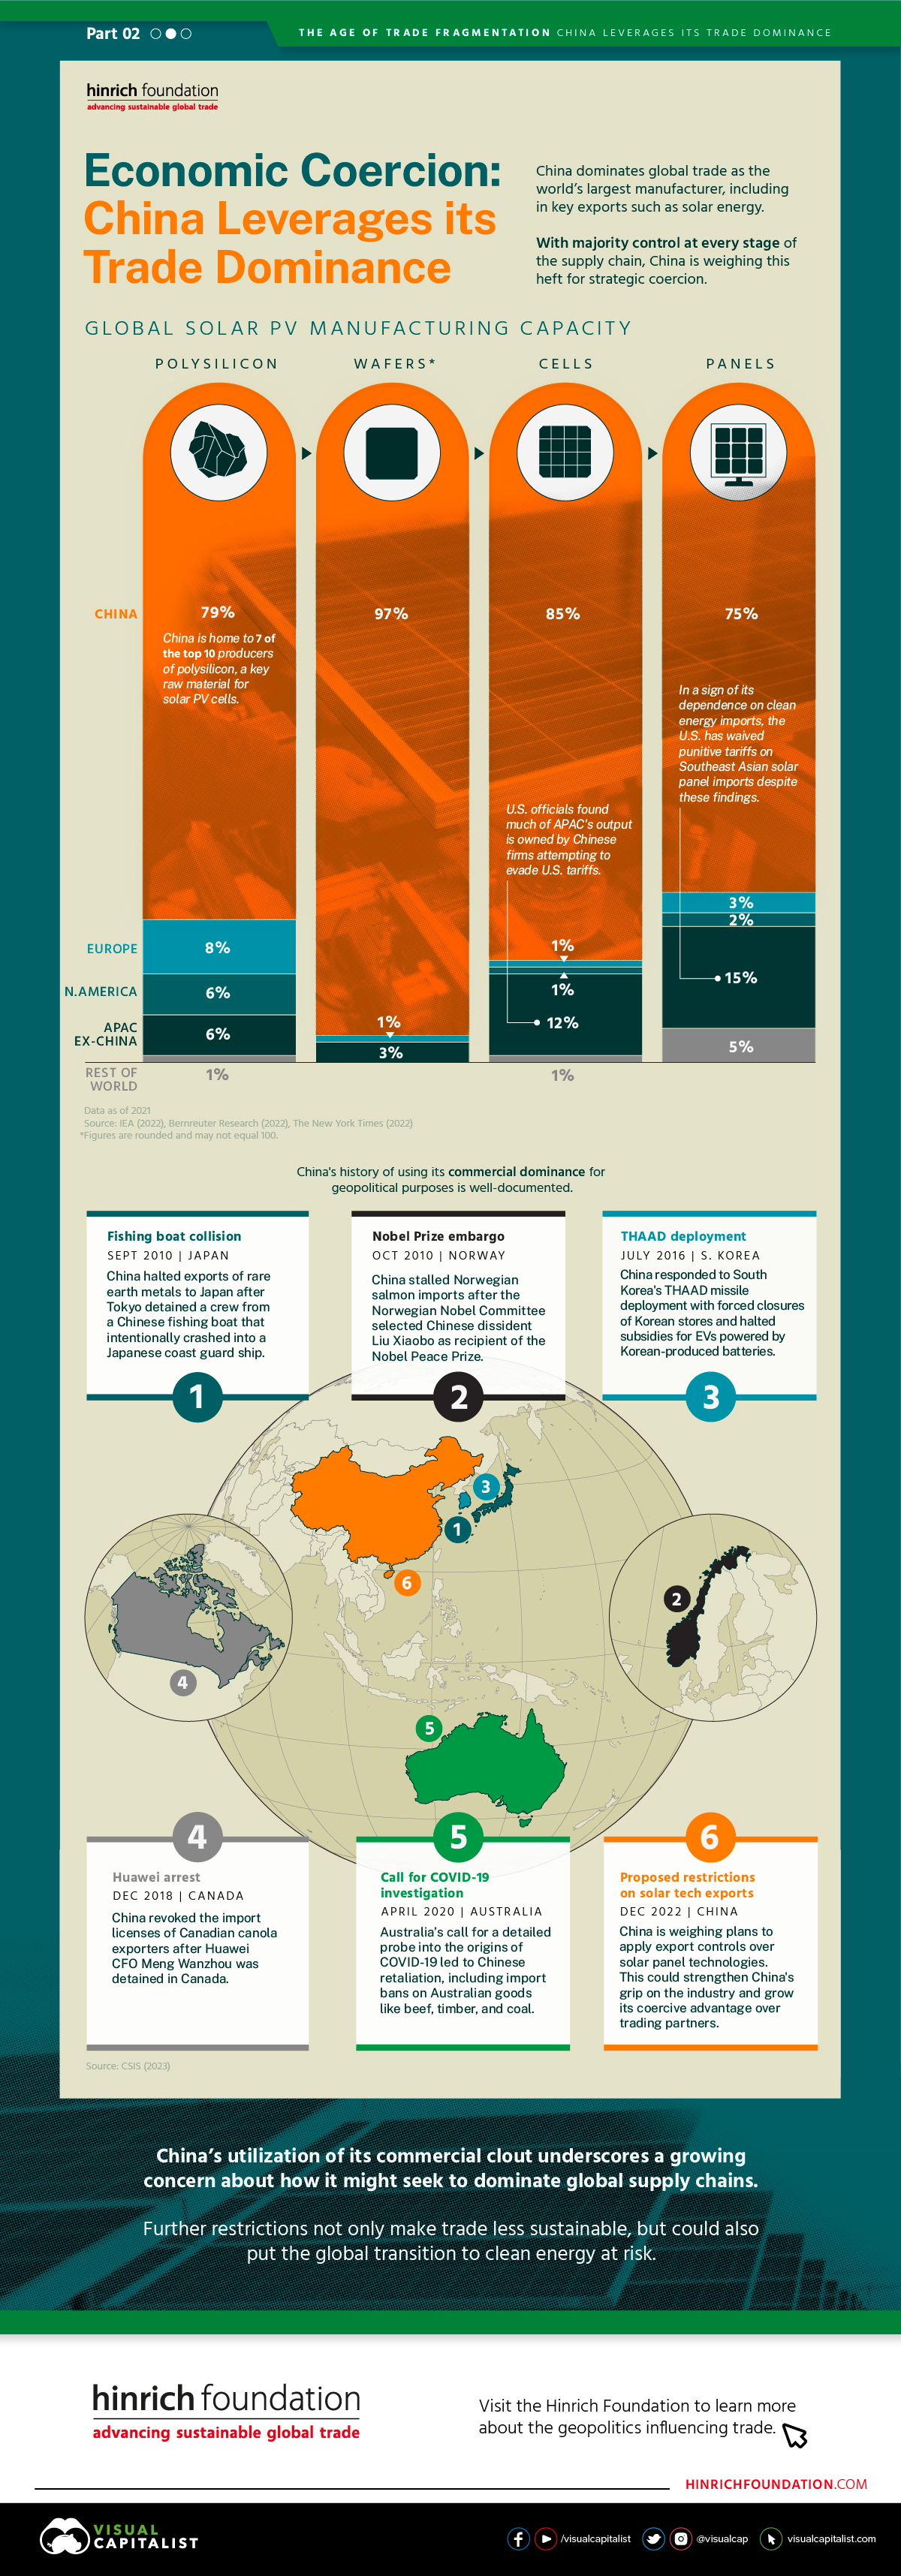
Economic Coercion: China’s Leverage in Trade
China's dominance in the solar photovoltaic (PV) supply chain gives it the potential to use its position as leverage in geopolitics, according to an infographic sponsored by The Hinrich Foundation. China is home to seven of the top 10 producers of polysilicon, a key raw material needed to create solar PV wafers, and it is also dominant in the manufacturing of wafers and cells.
Read details below
Читать полностью…
Venture Capital
17 декабря 2023 19:00
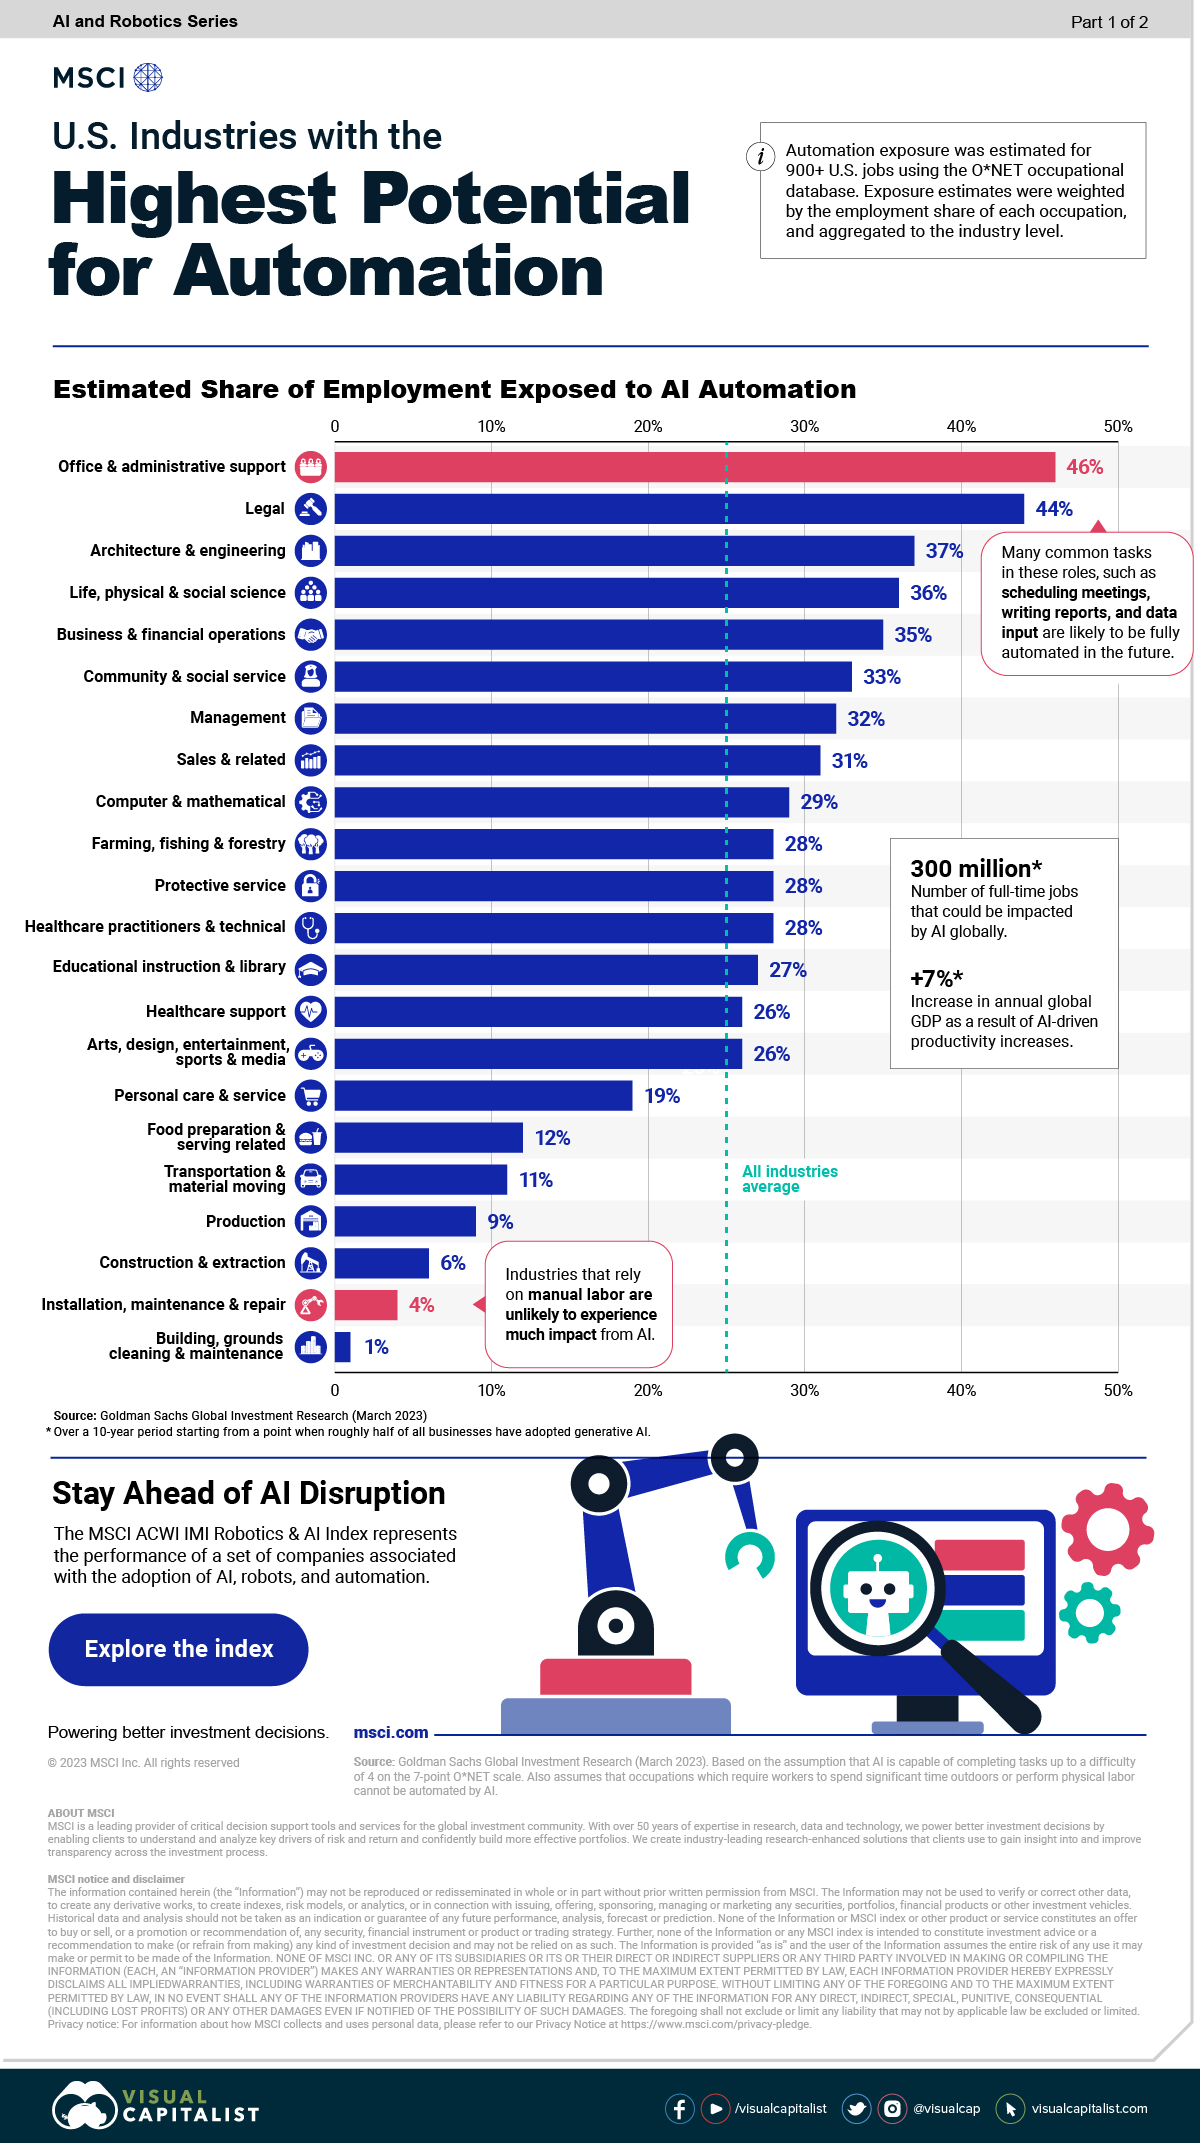
Ranking Industries by Their Potential for AI Automation
US industries that will be most exposed to automation of their workforces were identified and ranked by their degree of vulnerability. Investment bank Goldman Sachs produced an analysis estimating that 46% of jobs in the "office and administrative" sector could be exposed to AI driven automation, while 44% of workers in the "legal" industry may be affected. As expected, industries such as "construction and extraction" that rely heavily on manual labour, are less likely to be impacted.
Read details below
Читать полностью…
Venture Capital
16 декабря 2023 19:00
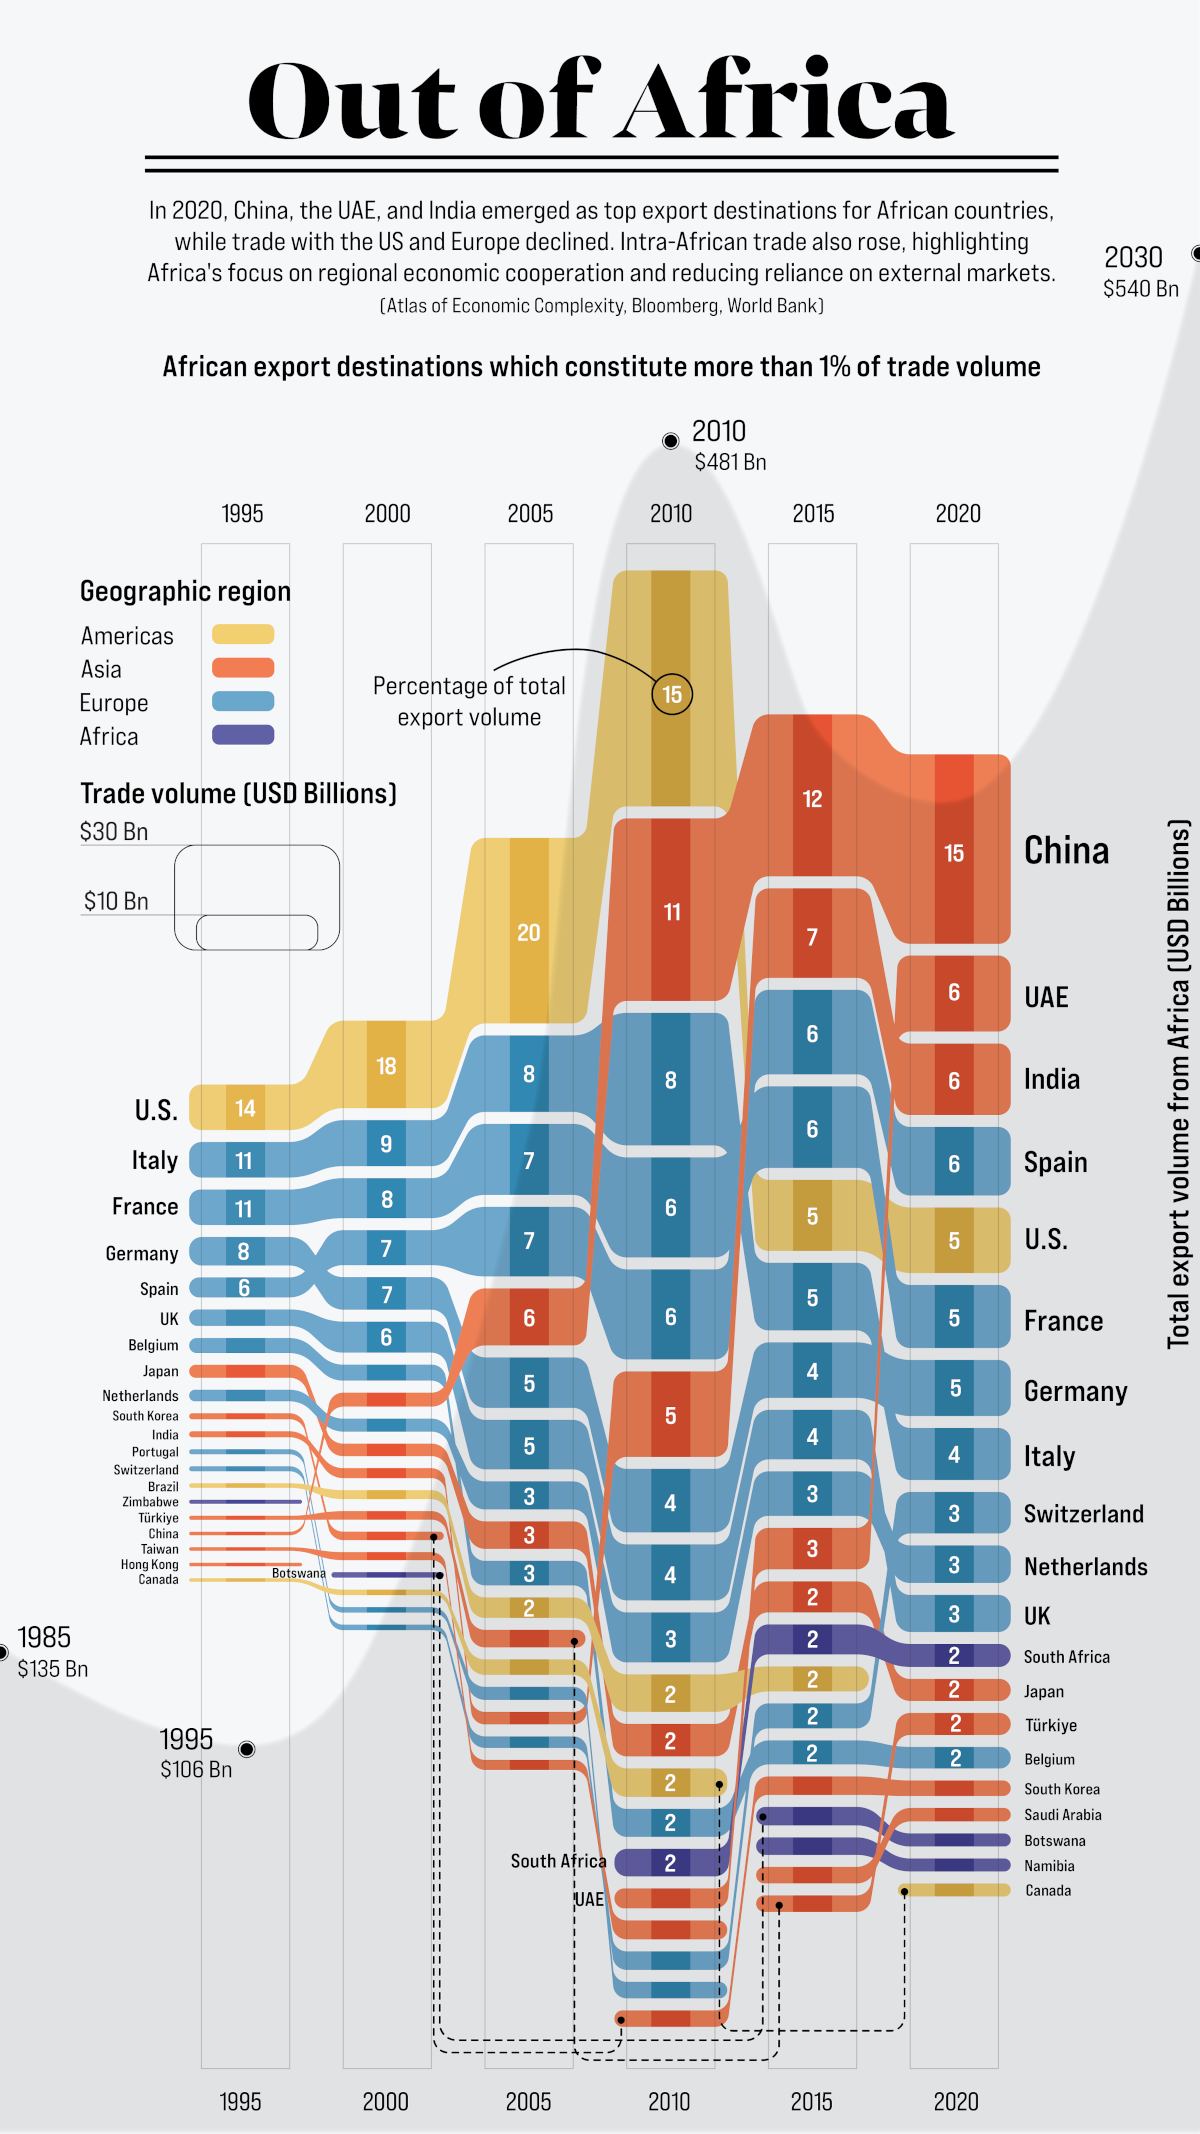
Charted: Top Destinations for Africa’s Exports (1995-2020)
Over the past 30 years, exports from African countries have tripled, with Asia now being the key destination, according to data from Harvard’s Atlas of Economic Complexity, the World Bank, and Bloomberg. At its height in 2005, the US accounted for one-fifth of the continent’s exports, mainly in petroleum products but has reduced African petroleum imports since 2010. Between 2010 and 2020, China became the primary destination, accounting for 20%, while India (9.5%) and the UAE (6.2%) also accounted for significant volumes.
Read details below
Читать полностью…
Venture Capital
15 декабря 2023 19:00
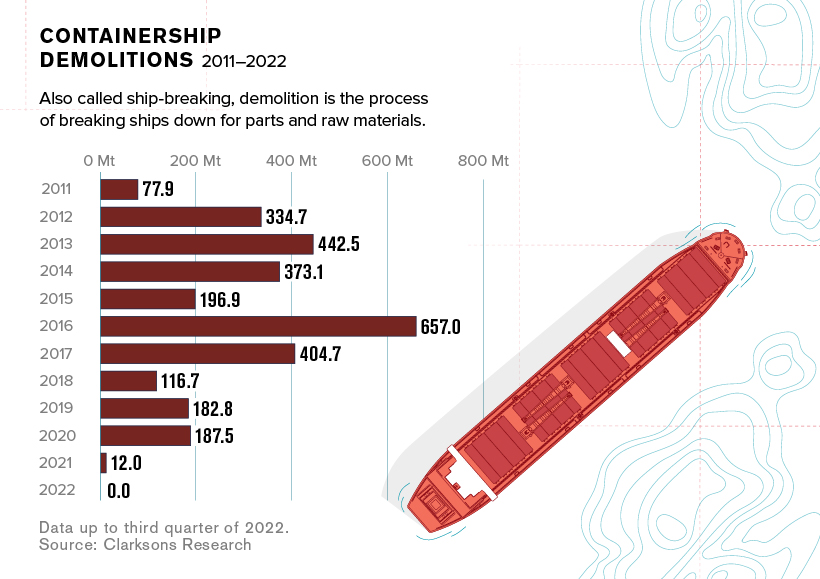
From Sea to Shining Sea: How Does Shipping Work?
The shipping industry handles 80% of global trade and provides low-cost transportation for a wide range of goods. In 2022, nearly 11 billion tons of goods took sea journeys. The global shipping fleet is big and numbered 102,899 ships over 100 gross tons in 2022. Containerships continue to grow in size as ship owners pursue greater economies of scale. Ship-breaking, the process of disassembling ships for parts and raw materials, has stalled. With new container ships set to hit the seas, there might not be enough containers to go around.
Read details below
Читать полностью…
Venture Capital
28 декабря 2023 19:00
Mapped: World’s Top 40 Largest Military Budgets
According to data from the Stockholm International Peace Research Institute (SIPRI), global military budgets reached an all-time high of $2.2 trillion in 2022, marking the eighth consecutive year of increase. The United States had the largest military budget, accounting for almost 40% of global military expenditures. China ranked second with a military budget of $292 billion, followed by Russia, India, and Saudi Arabia. However, the lowest budgets in the top 40 ranged from $5.2 billion to $5.6 billion.
Read details below
Читать полностью…
Venture Capital
28 декабря 2023 12:00
Mapped: Global Sentiment on AI
The World Risk Poll 2021, conducted in 121 countries with 125,000 respondents, revealed the global opinion on artificial intelligence (AI) is divided. The poll asked whether AI would "mostly help" or "mostly hurt" people in their home country over the next 20 years. The average ratio of those who believe AI will help versus harm is 1.4 globally. However, significant regional differences exist. Notably, the US showed skepticism towards AI with a ratio of 0.9, while China expressed a ratio of 4.5, indicating greater confidence in AI.
Read details below
Читать полностью…
Venture Capital
27 декабря 2023 12:00
The 50 Best One-Year Returns on the S&P 500 (1980-2022)
The S&P 500 had an average annual return of 10% from 1980 to 2022, excluding dividends. S&P Dow Jones Indices analyzed the top 10 best-performing stocks each year and narrowed it down to the top 50 overall to identify the S&P 500 stocks with the best single-year returns. The best gains were observed during the 1999 dot-com boom, the 2003 stock market rally, and the 2009 recovery from the Global Financial Crisis. Qualcomm had the highest single-year return, benefiting from its patents for CDMA technology.
Read details below
Читать полностью…
Venture Capital
26 декабря 2023 12:00
Vintage Viz: The World’s Rivers and Lakes, Organized Neatly
A visualization of the principal rivers and lakes in the world, published in 1850, has been showcased by data visualisation company Visual Capitalist. The image depicts 42 rivers and 36 lakes, with the rivers ordered by size. The largest rivers illustrated are the Mississippi, followed by the Amazon and Nile. The Yangtze is the fourth-longest, followed by the Mackenzie, in Canada. The 1850 numbers for the three largest rivers diverge from 20th-century measurements, but the creators said the graphic provide an insight into the difficulties faced by early cartographers.
Read details below
Читать полностью…
Venture Capital
25 декабря 2023 15:00
Meet the Competing Apps Battling for Twitter’s Market Share
Several microblogging platforms are vying for Twitter's massive user base, offering diverse solutions and appealing features. Meta's Threads, which leverages the success of Instagram, quickly gained over 30 million users on its launch day. Mastodon, a decentralized platform that provides user control over data and privacy, has seen increased popularity with users who disagree with Elon Musk's control over Twitter. BlueSky, a decentralized platform founded by Twitter co-founder Jack Dorsey, already has 1.2 million potential users on its waitlist. Spill, created by former Twitter employees, aims to foster diverse communities.
Read details below
Читать полностью…
Venture Capital
24 декабря 2023 12:00
Visualized: The Global Implications of Fertilizer Shortages
The global fertilizer market is currently experiencing a supply shortage, which could have harmful consequences if not addressed. Recent disruptions in the supply chain due to the COVID-19 pandemic and the war in Ukraine have caused fertilizer prices to skyrocket. While prices have started to stabilize, they are still significantly higher than pre-pandemic levels. The growing global population and changes in agricultural productivity will continue to impact long-term fertilizer prices. The rising prices of fertilizer have made it less accessible to farmers, particularly those in low-income, food-deficit countries.
Read details below
Читать полностью…
Venture Capital
23 декабря 2023 12:00
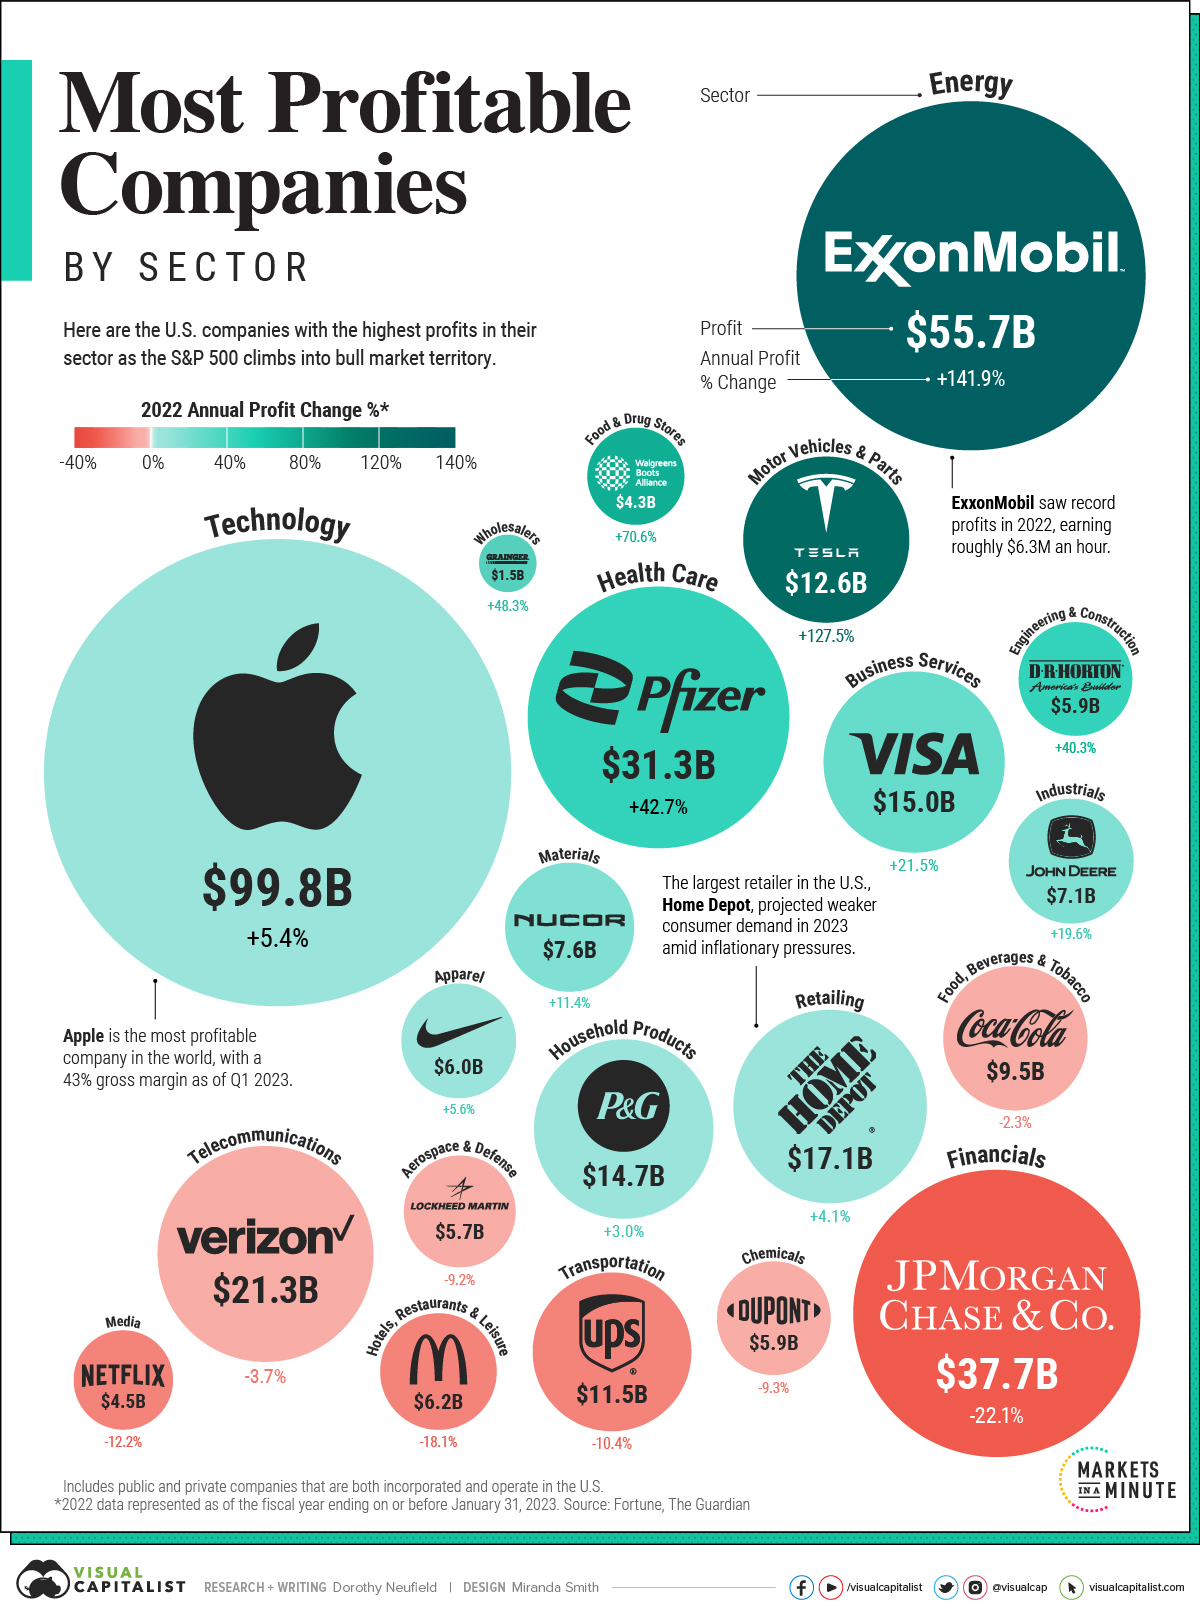
Ranked: The Most Profitable U.S. Companies, by Sector
Despite a bear market and high inflation, US corporate profits reached record levels in 2022. Corporate profit margins have become a key measure of financial health as they act as a buffer against higher borrowing costs and price pressures. Apple is the most profitable company in America, with profits of nearly $100 billion in 2022. Exxon Mobil and JPMorgan Chase were the most profitable in the energy and financial sectors, respectively.
Read details below
Читать полностью…
Venture Capital
22 декабря 2023 12:00
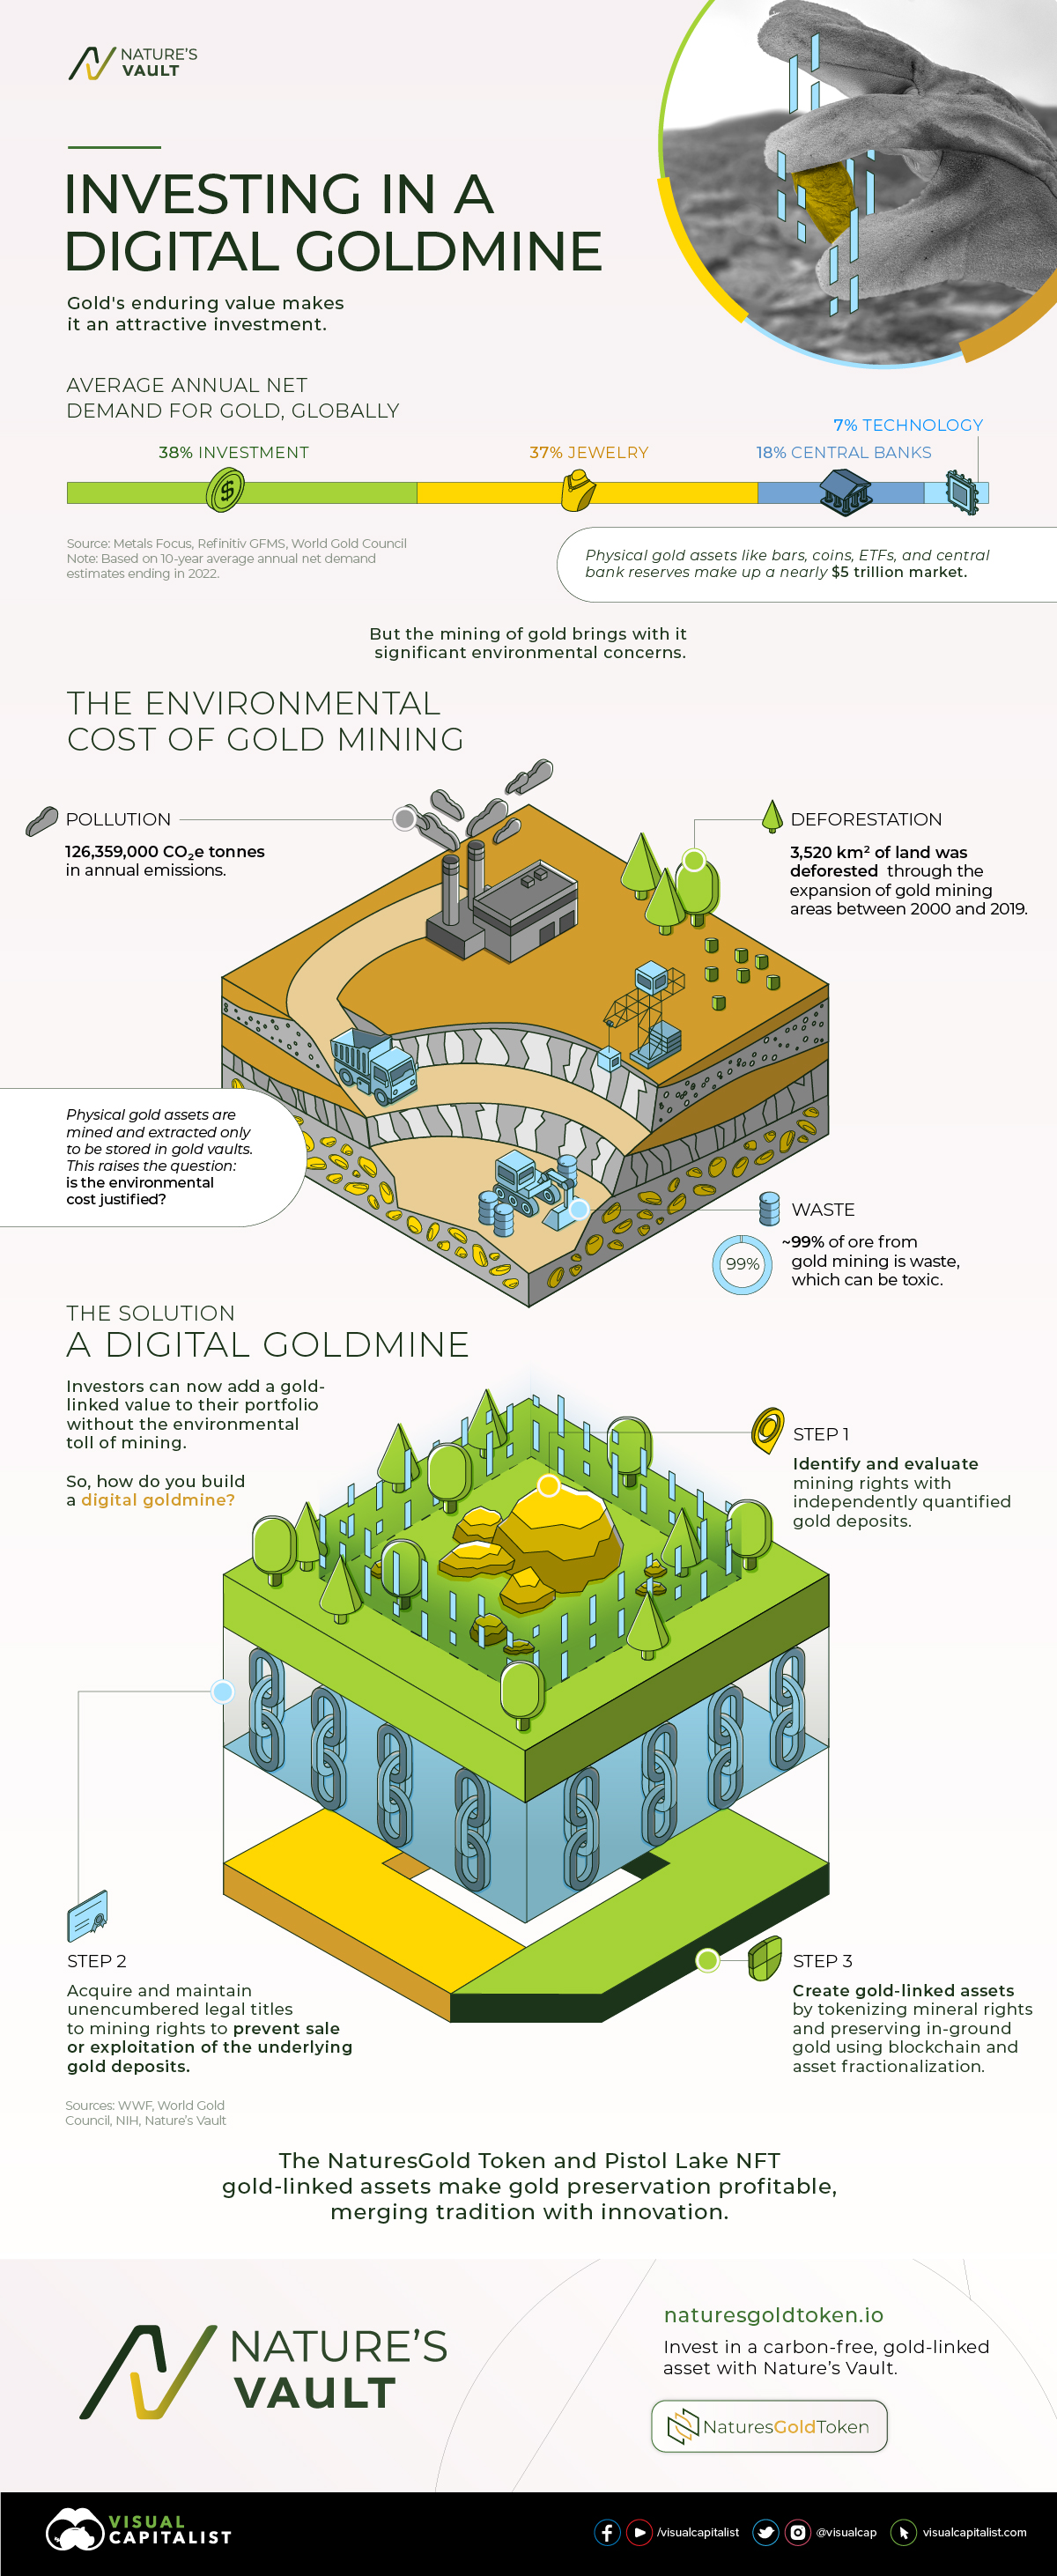
Visualized: What is a Digital Goldmine?
Gold mining has significant environmental costs, including deforestation, waste production, and carbon emissions. The expansion of gold mines has led to over 3,500 km2 of deforestation and annual emissions of around 126 million tonnes of CO2e. Additionally, about 99% of the ore extracted from gold mining goes to waste, with the tailings containing high levels of heavy metals that can harm ecosystems. Nature's Vault is offering gold-linked assets as an environmentally friendly alternative to physical gold mining.
Read details below
Читать полностью…
Venture Capital
21 декабря 2023 12:00
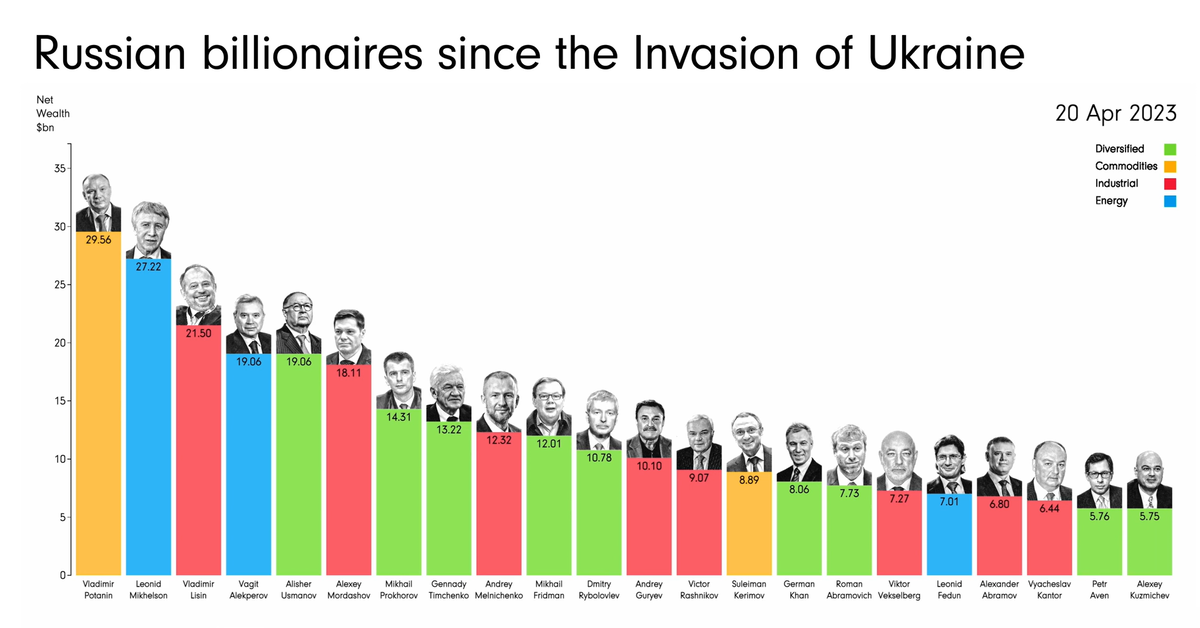
Animated: Change in Russian Billionaires’ Wealth Since 2022
The net worth of the 22 wealthiest Russian billionaires on the Bloomberg Billionaires Index has decreased by a total of $90.4 billion since the start of the conflict in Ukraine in February 2022. This is largely due to the intensified sanctions imposed on these individuals and their companies. Viktor Vekselberg, a stakeholder in UC Rusal, the world's third-largest aluminum producer, has lost $11.3 billion or 61% of his net worth.
Read details below
Читать полностью…
Venture Capital
20 декабря 2023 19:00
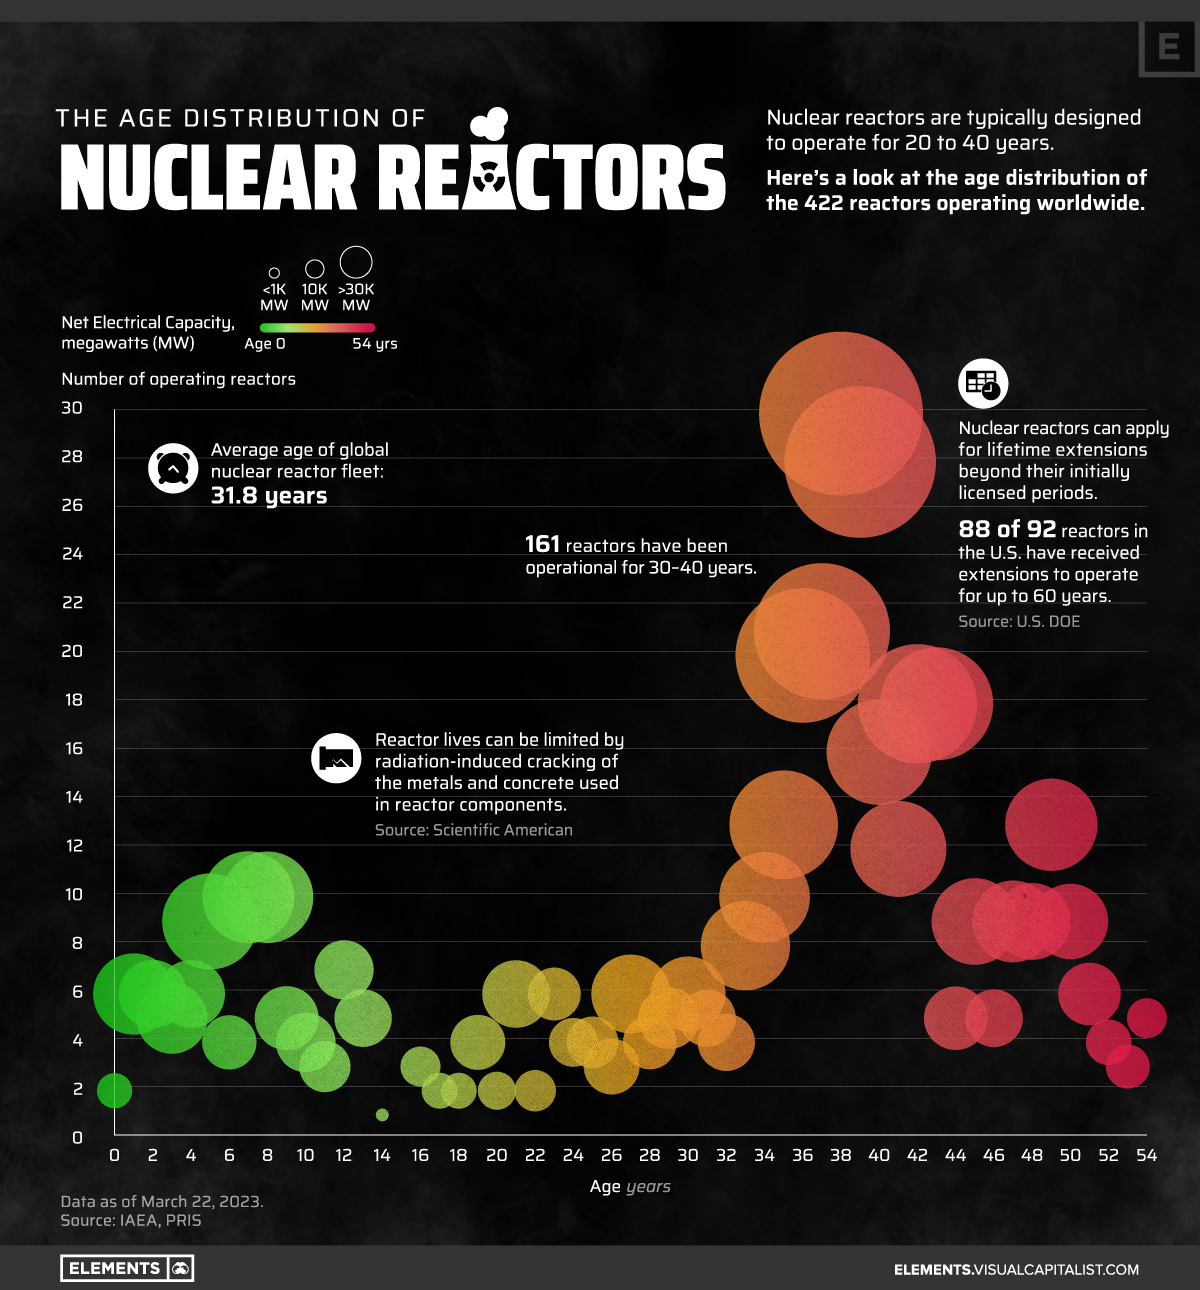
How Old Are the World’s Nuclear Reactors?
The majority of the world's nuclear reactors were connected to the grid between 1973 and 1992, according to data from the Power Reactor Information System (PRIS). Of the 422 reactors currently operating worldwide, 262 have been in operation for 31 to 50 years. Growth in nuclear power slowed down in the 21st century, but over the last decade, some countries have renewed their interest in nuclear energy. The oldest operating reactors are 54 years old and were built in 1969.
Read details below
Читать полностью…
Venture Capital
19 декабря 2023 12:00
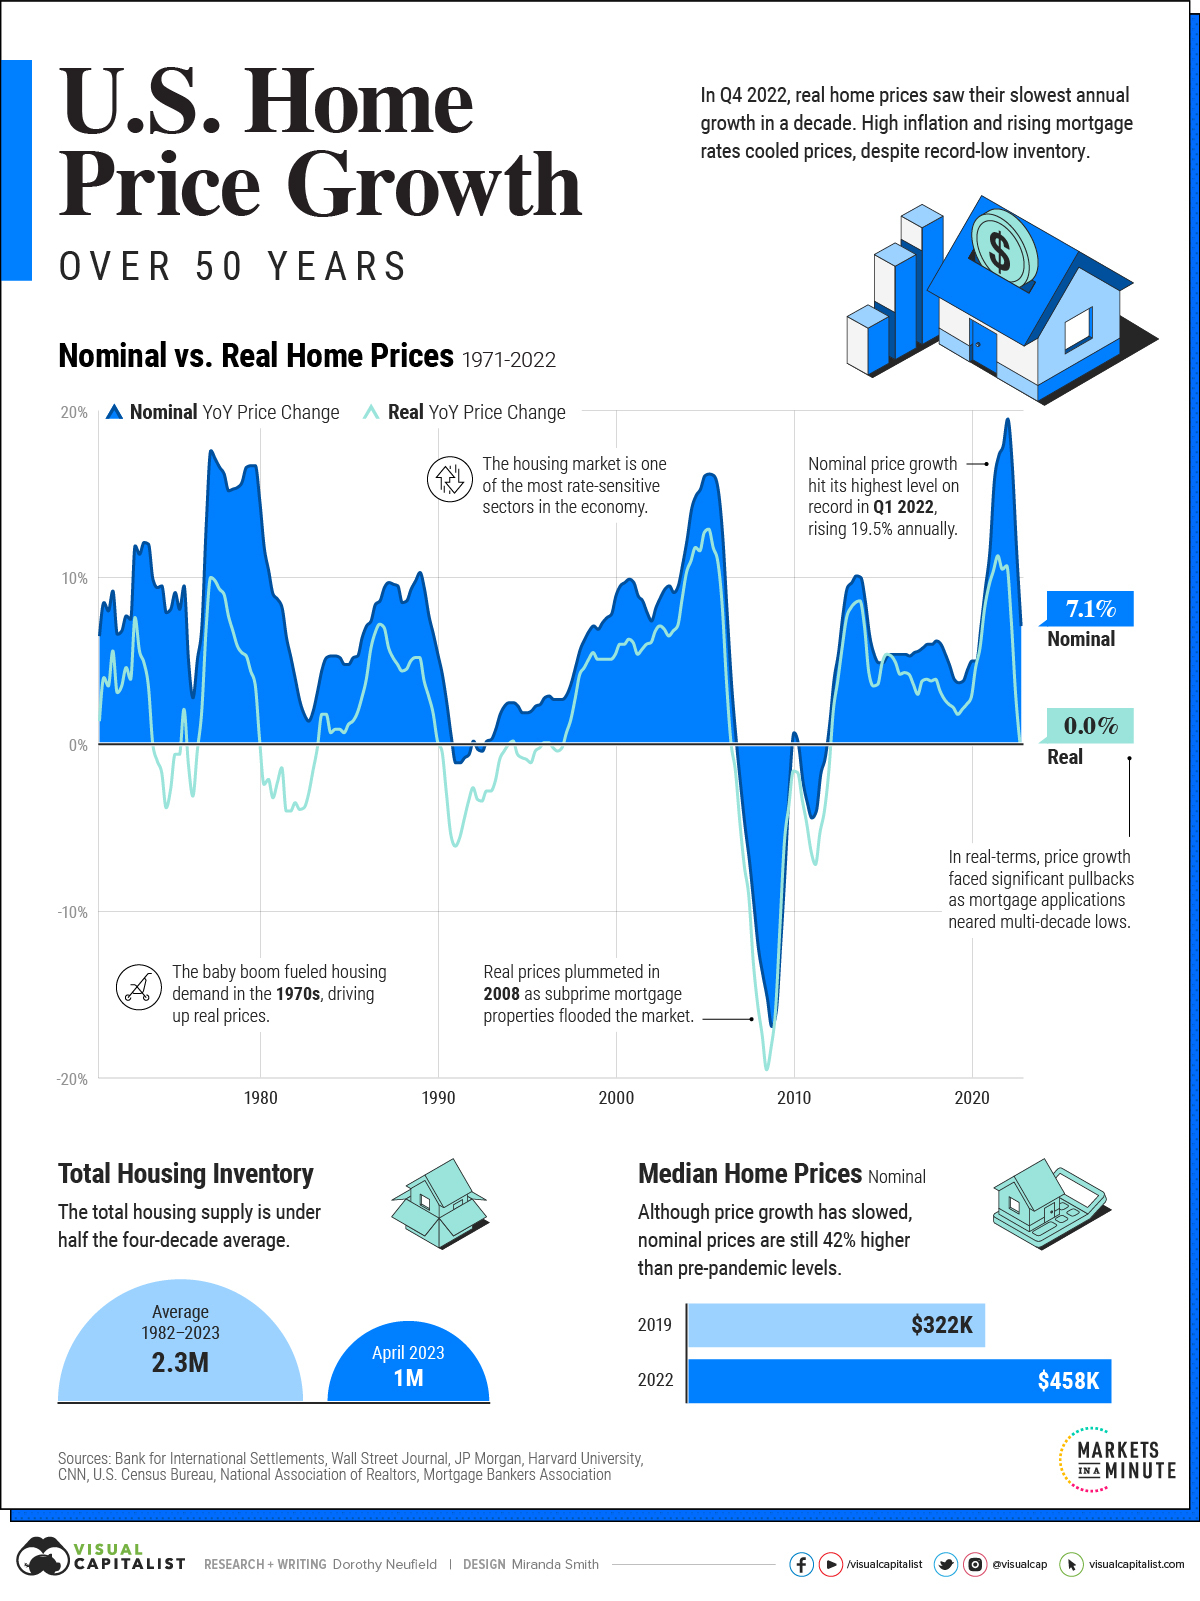
Chart: U.S. Home Price Growth Over 50 Years
U.S. home prices experienced significant growth in 2022, despite rising interest rates. However, when adjusted for inflation, the growth rate was considerably lower. By Q4 2022, real price growth had slowed to zero percent, making it the slowest growth in a decade. This trend can be seen in a graphic comparing nominal and real residential property price growth over the past 50 years.
Read details below
Читать полностью…
Venture Capital
18 декабря 2023 12:00
What are Top Investment Managers Holding in Their Portfolios?
This article examines the portfolios of five top investment managers at the end of Q1 2023. It highlights the differences in portfolio compositions and investment strategies among the managers. Berkshire Hathaway, led by Warren Buffett, has a portfolio that is heavily concentrated in Apple, while also containing a mix of bank stocks, consumer staples, and oil and gas companies. Renaissance Technologies, headed by Jim Simons, has an astoundingly diversified portfolio split across more than 3,900 different positions.
Read details below
Читать полностью…
Venture Capital
17 декабря 2023 14:00
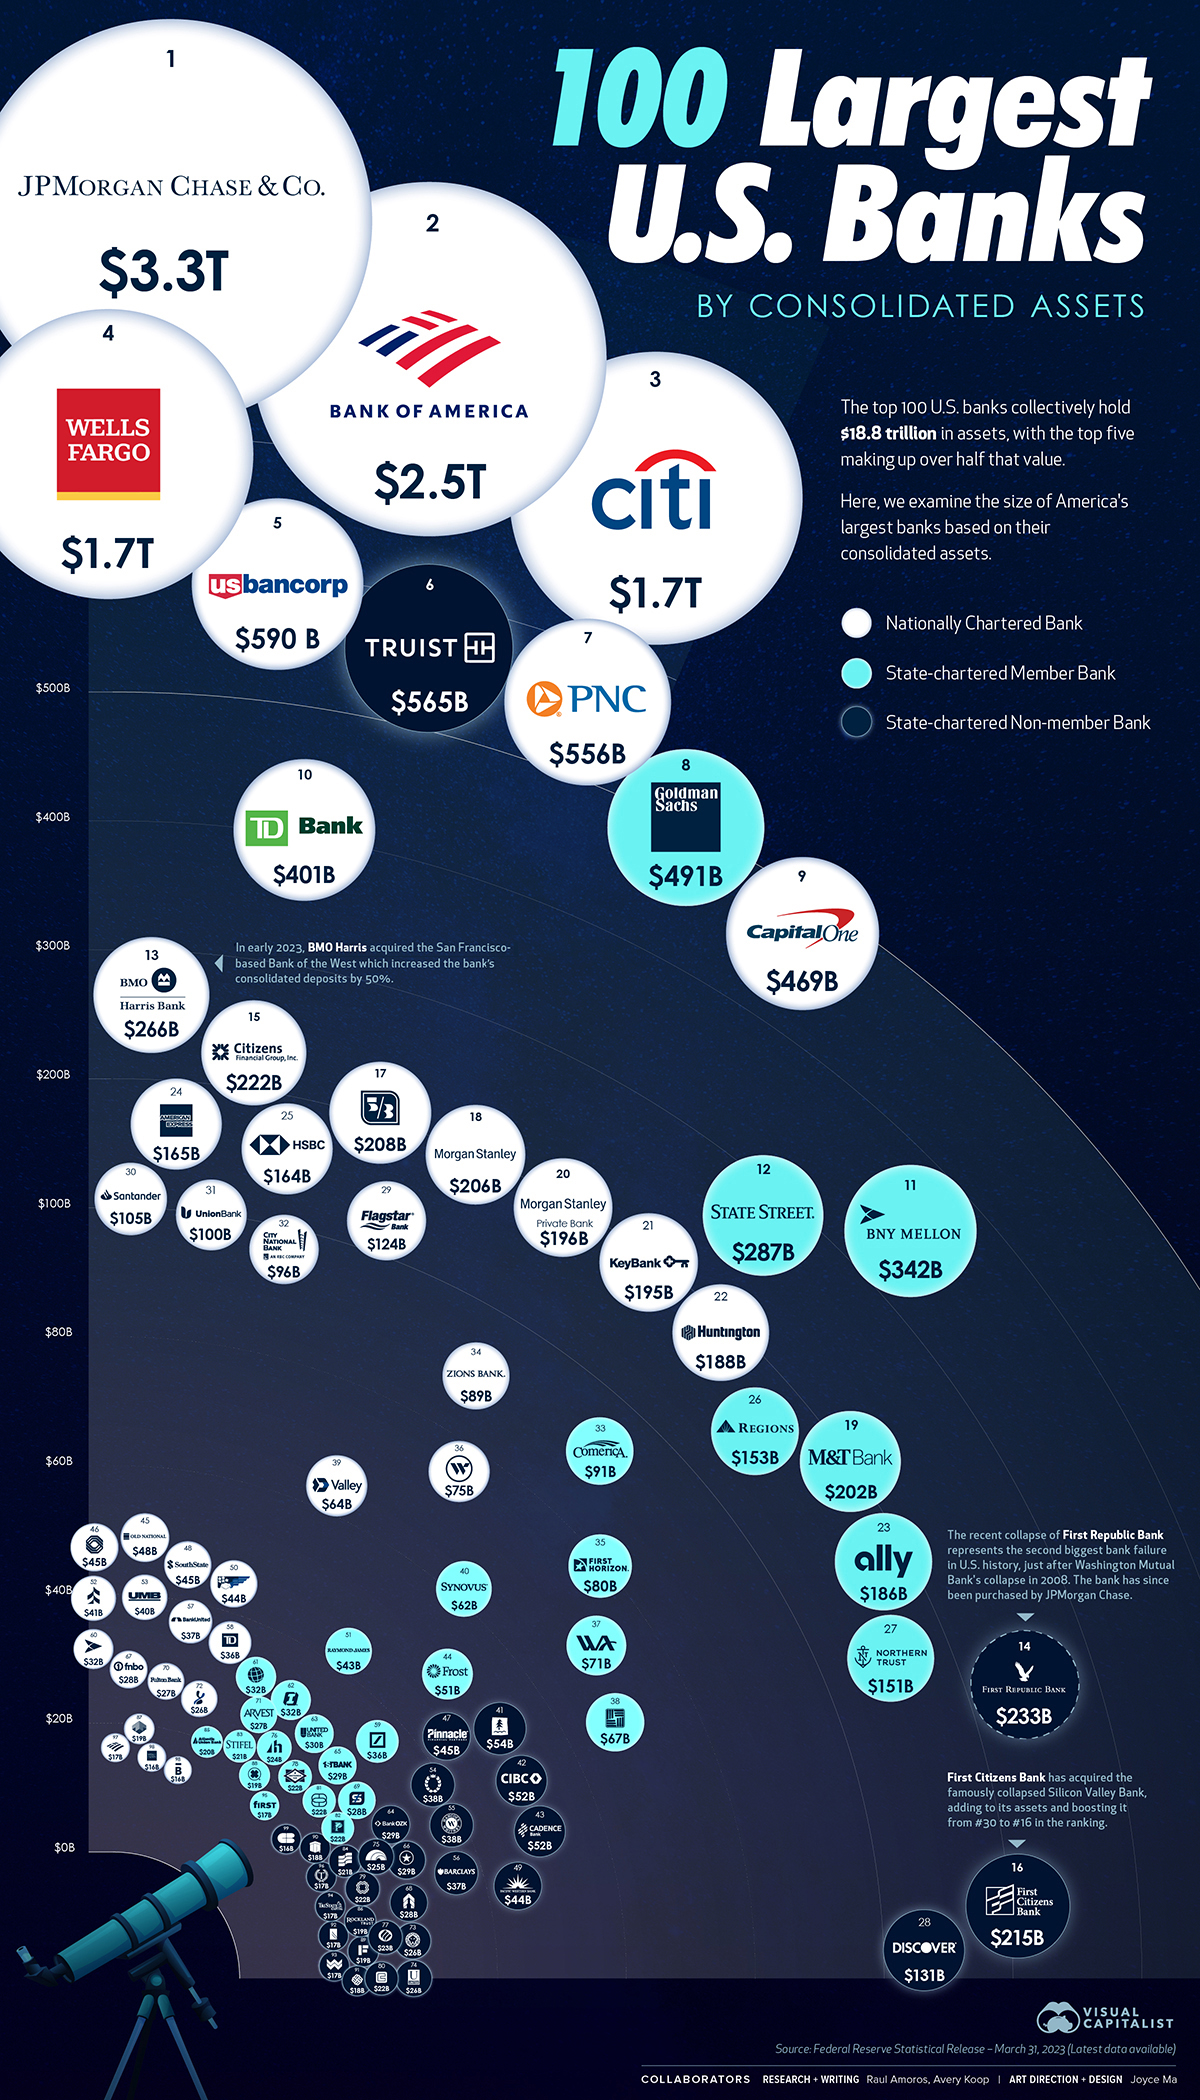
Visualized: The 100 Largest U.S. Banks by Consolidated Assets
The 100 largest banks in the US hold combined assets of $18.8tn, with JP Morgan the biggest with $3.3tn in assets, followed by Bank of America with $2.5tn, according to the Federal Reserve. However, medium sized bank collapses such as those of Silicon Valley Bank and First Republic have caused concerns in the sector. Volatility is also expected to have implications on the wider economy.
Read details below
Читать полностью…
Venture Capital
16 декабря 2023 12:00
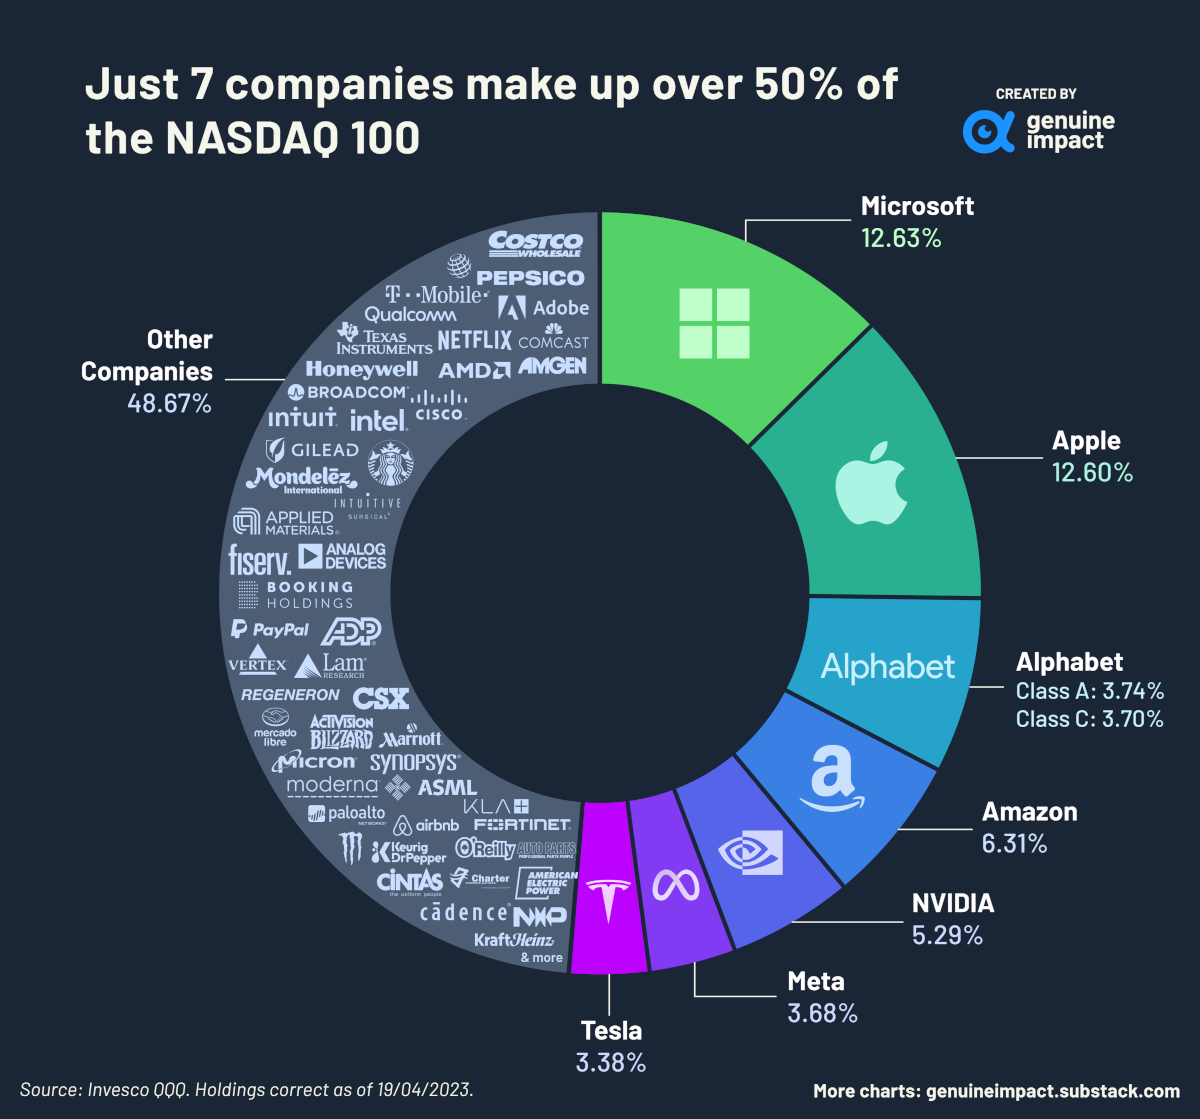
Charted: Companies in the Nasdaq 100, by Weight
The Nasdaq 100, launched in 1985, is a stock market index which tracks the performance of the largest non-financial companies listed on the Nasdaq stock exchange. The dominance of seven firms – Microsoft, Apple, Alphabet (Google), Amazon, NVIDIA, Meta and Tesla, which together accounted for over 50% of the index's total weight, reflects their important role in the wider consumer economy.
Read details below
Читать полностью…
Venture Capital
15 декабря 2023 12:00
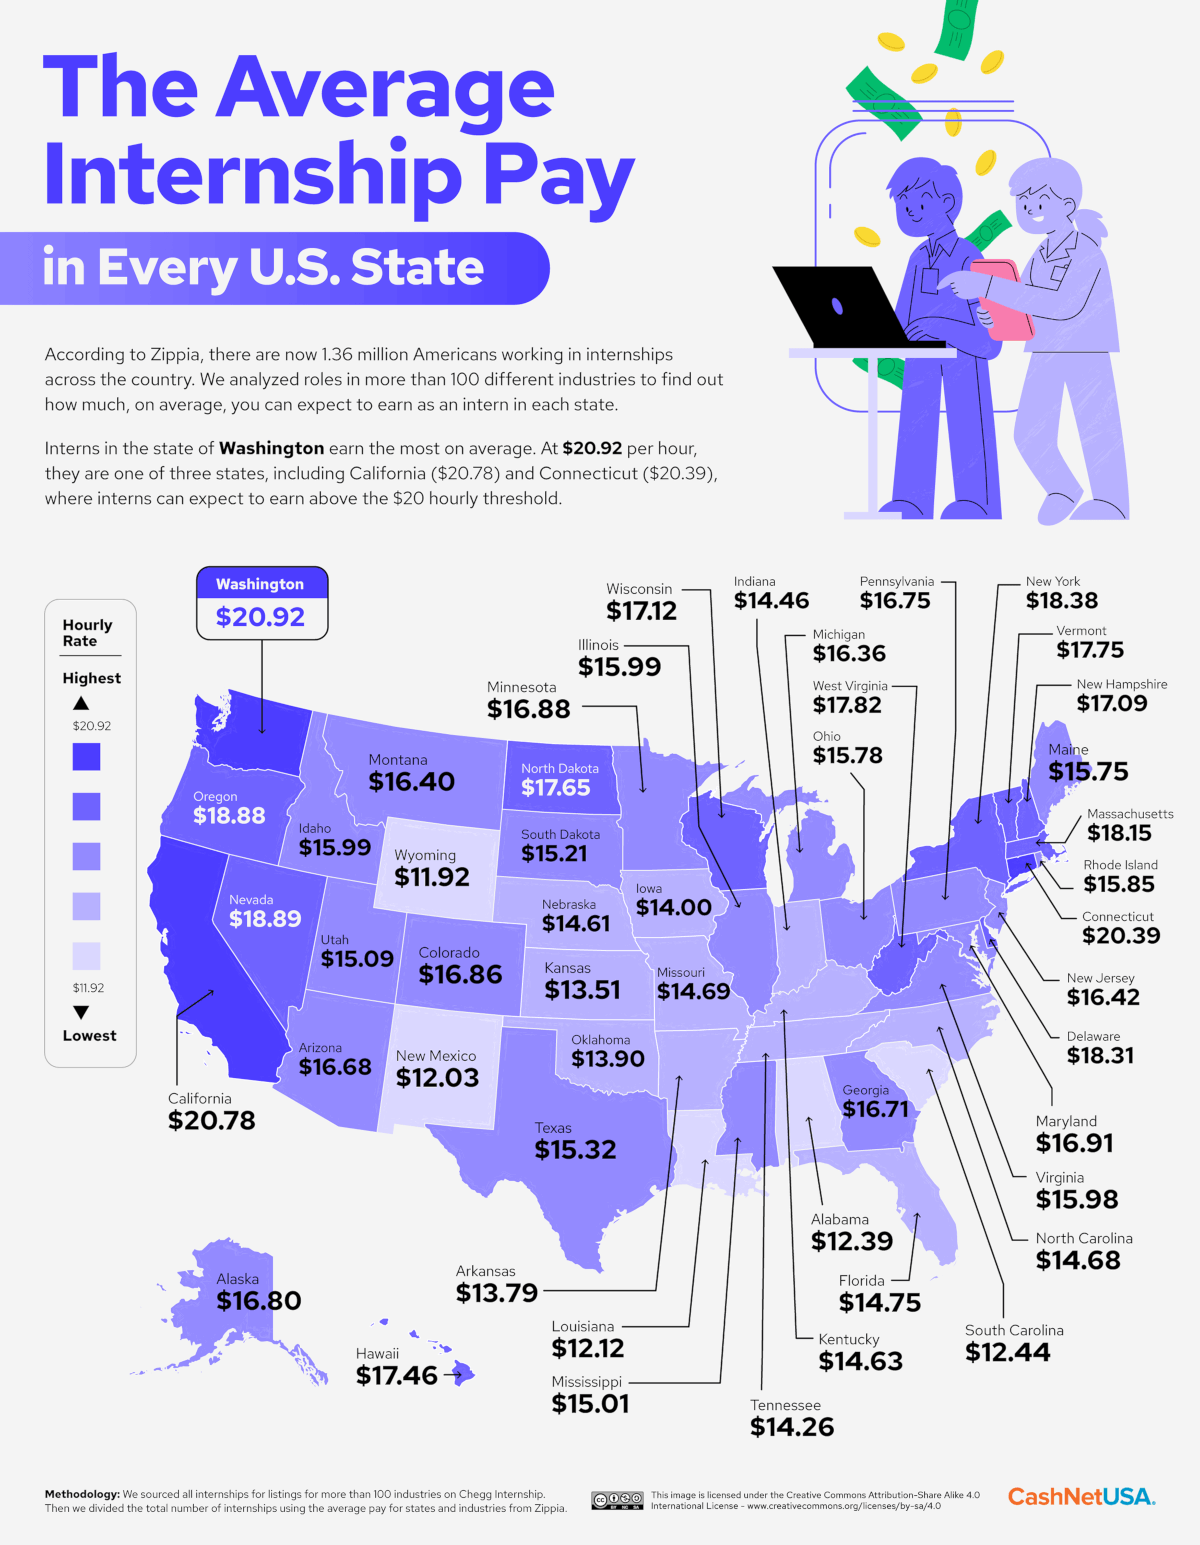
Mapped: Average Internship Salary By U.S. State in 2022
Internships are becoming more common in modern working life and offer paid or unpaid positions to individuals across many sectors. CashNetUSA has put together data, collected from listings on Chegg Internships and Zippia, reflecting average internship salary rates across states and sectors in the US. The data indicates that interns in Washington, California and Connecticut command the highest salaries of over $20 an hour, while salaries are lowest in Wyoming, New Mexico and Louisiana at around $12/hour.
Read details below
Читать полностью…


 4490931